Chromatic confocal Microscopy (Diavite Optic)
Here we show different application examples of our chromatic-confocal measuring head RB-400-90°, integrated in the Diavite Optic measuring station.
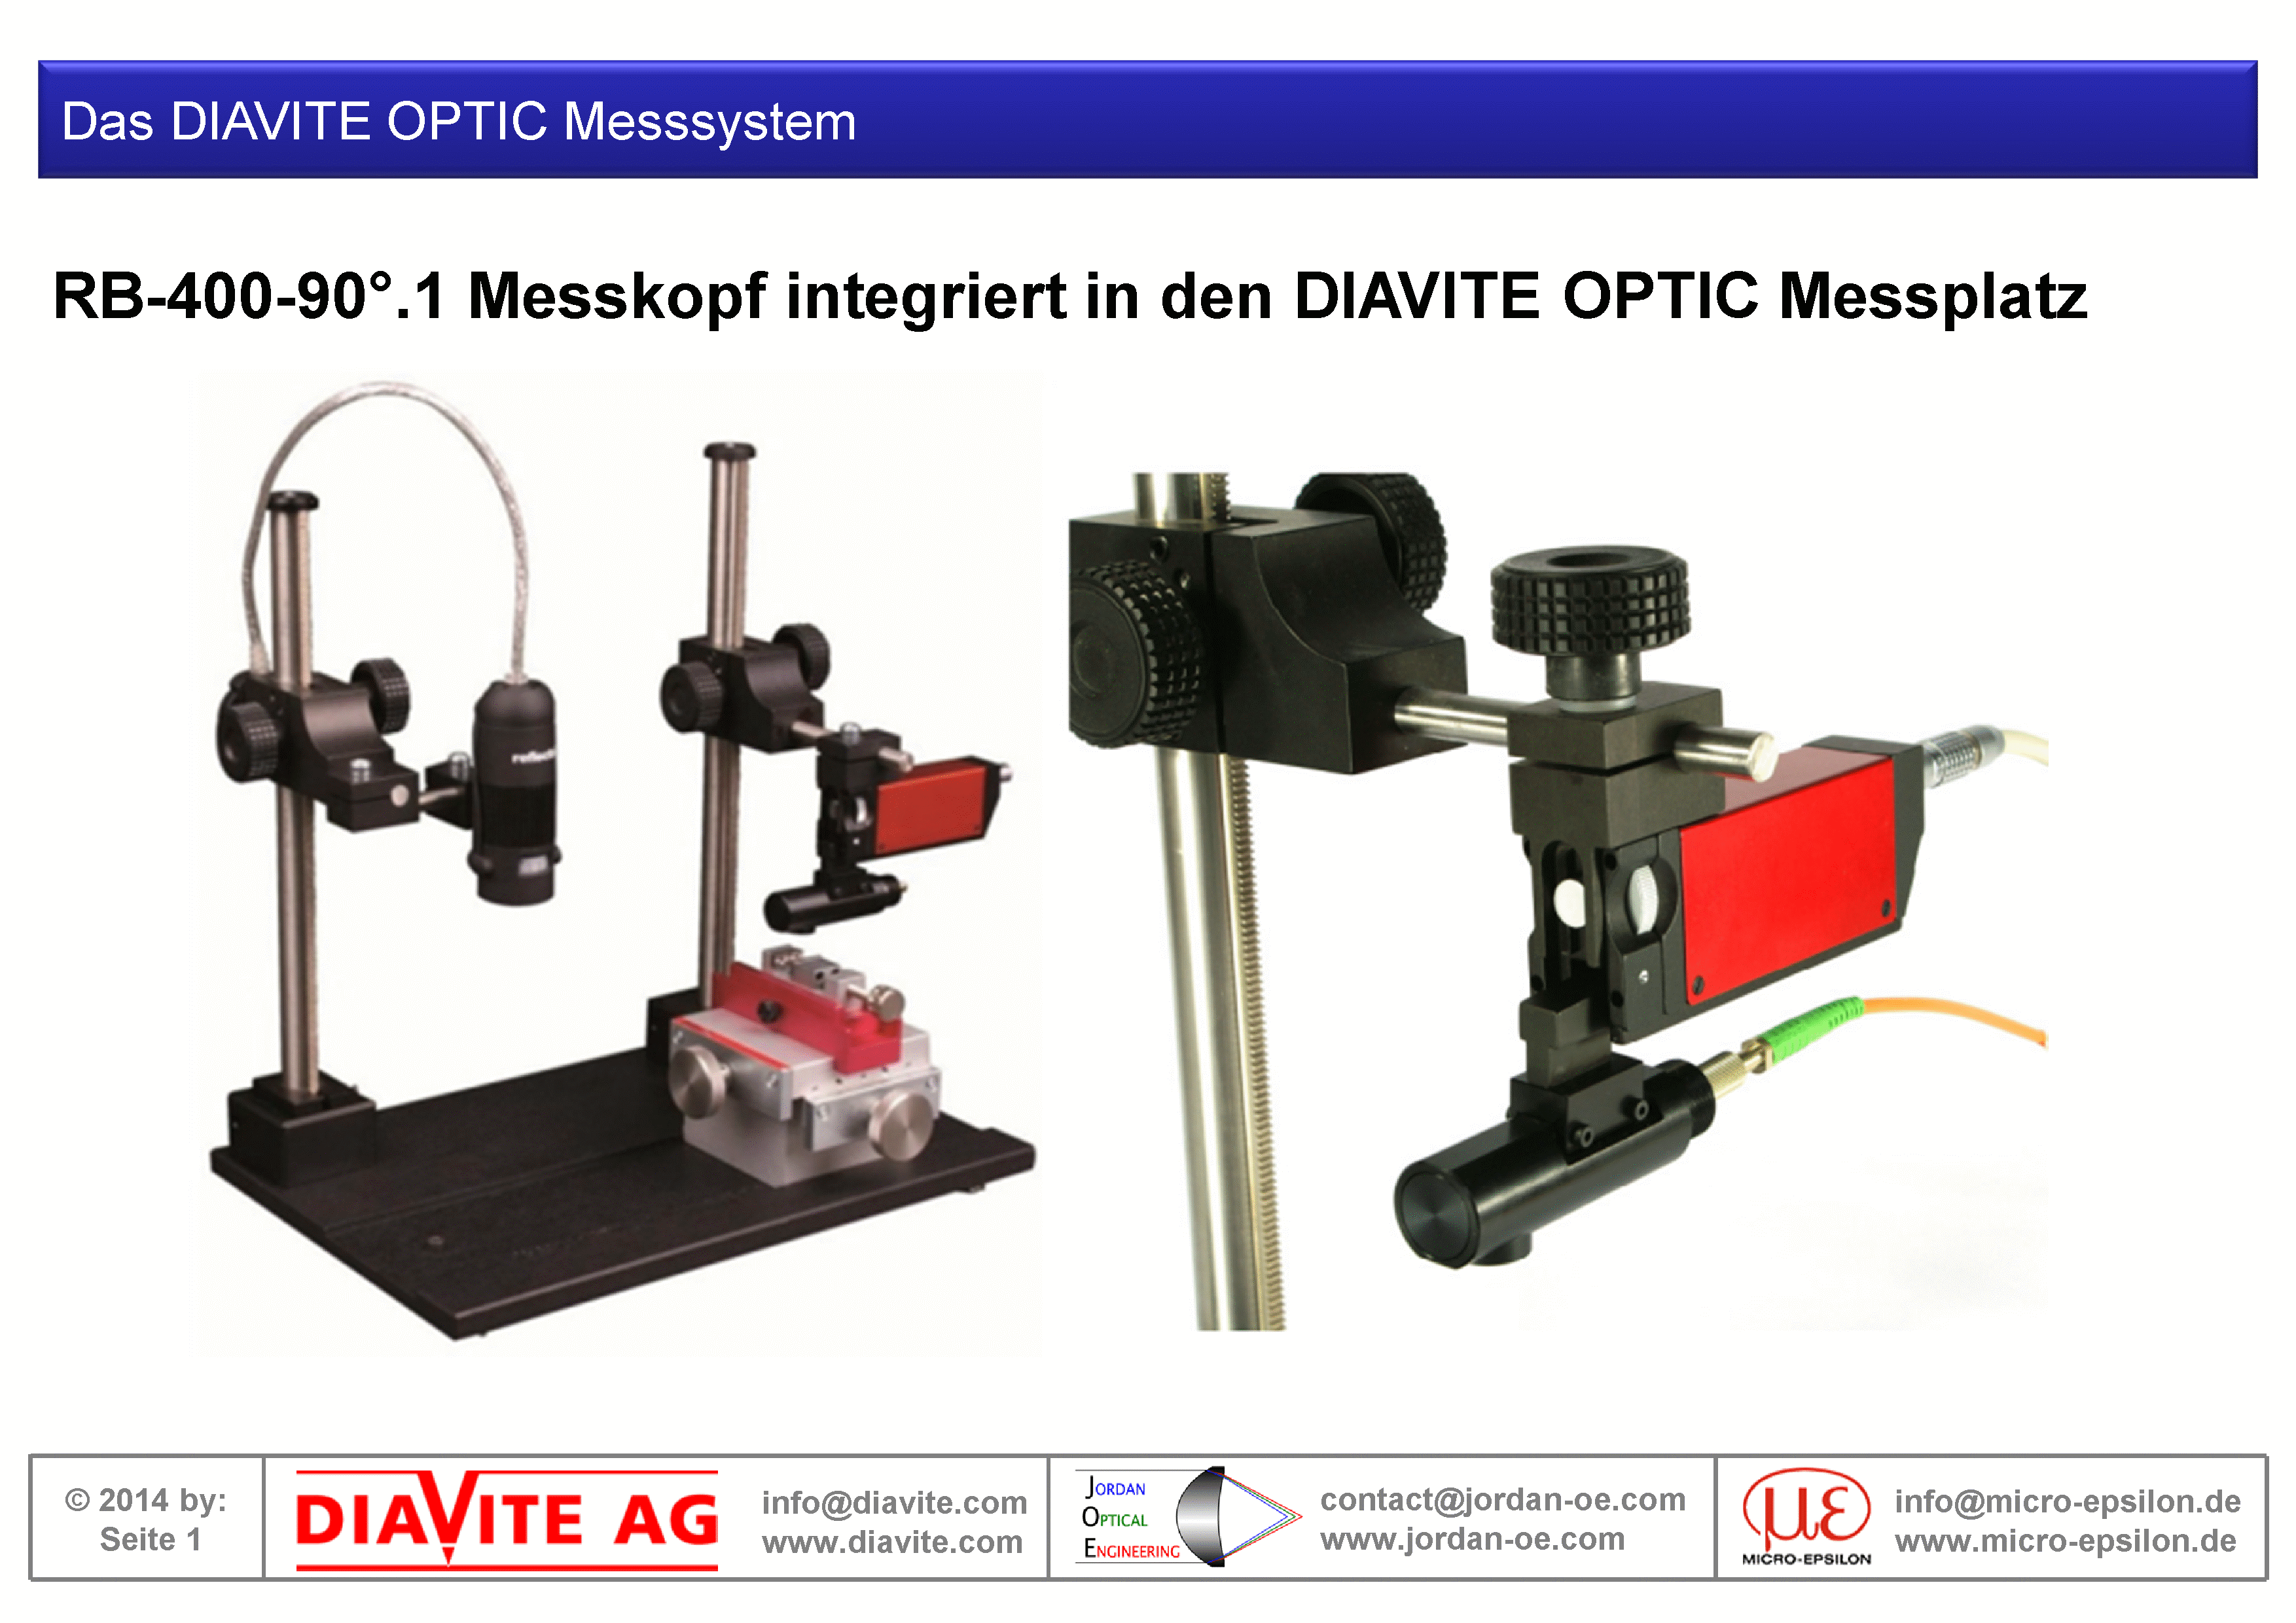
Diavite Optic
An optical RB-400-90°.1 measuring head is integrated in the Diavite Optic measuring system. In addition, tactile comparison measurements can also be performed.
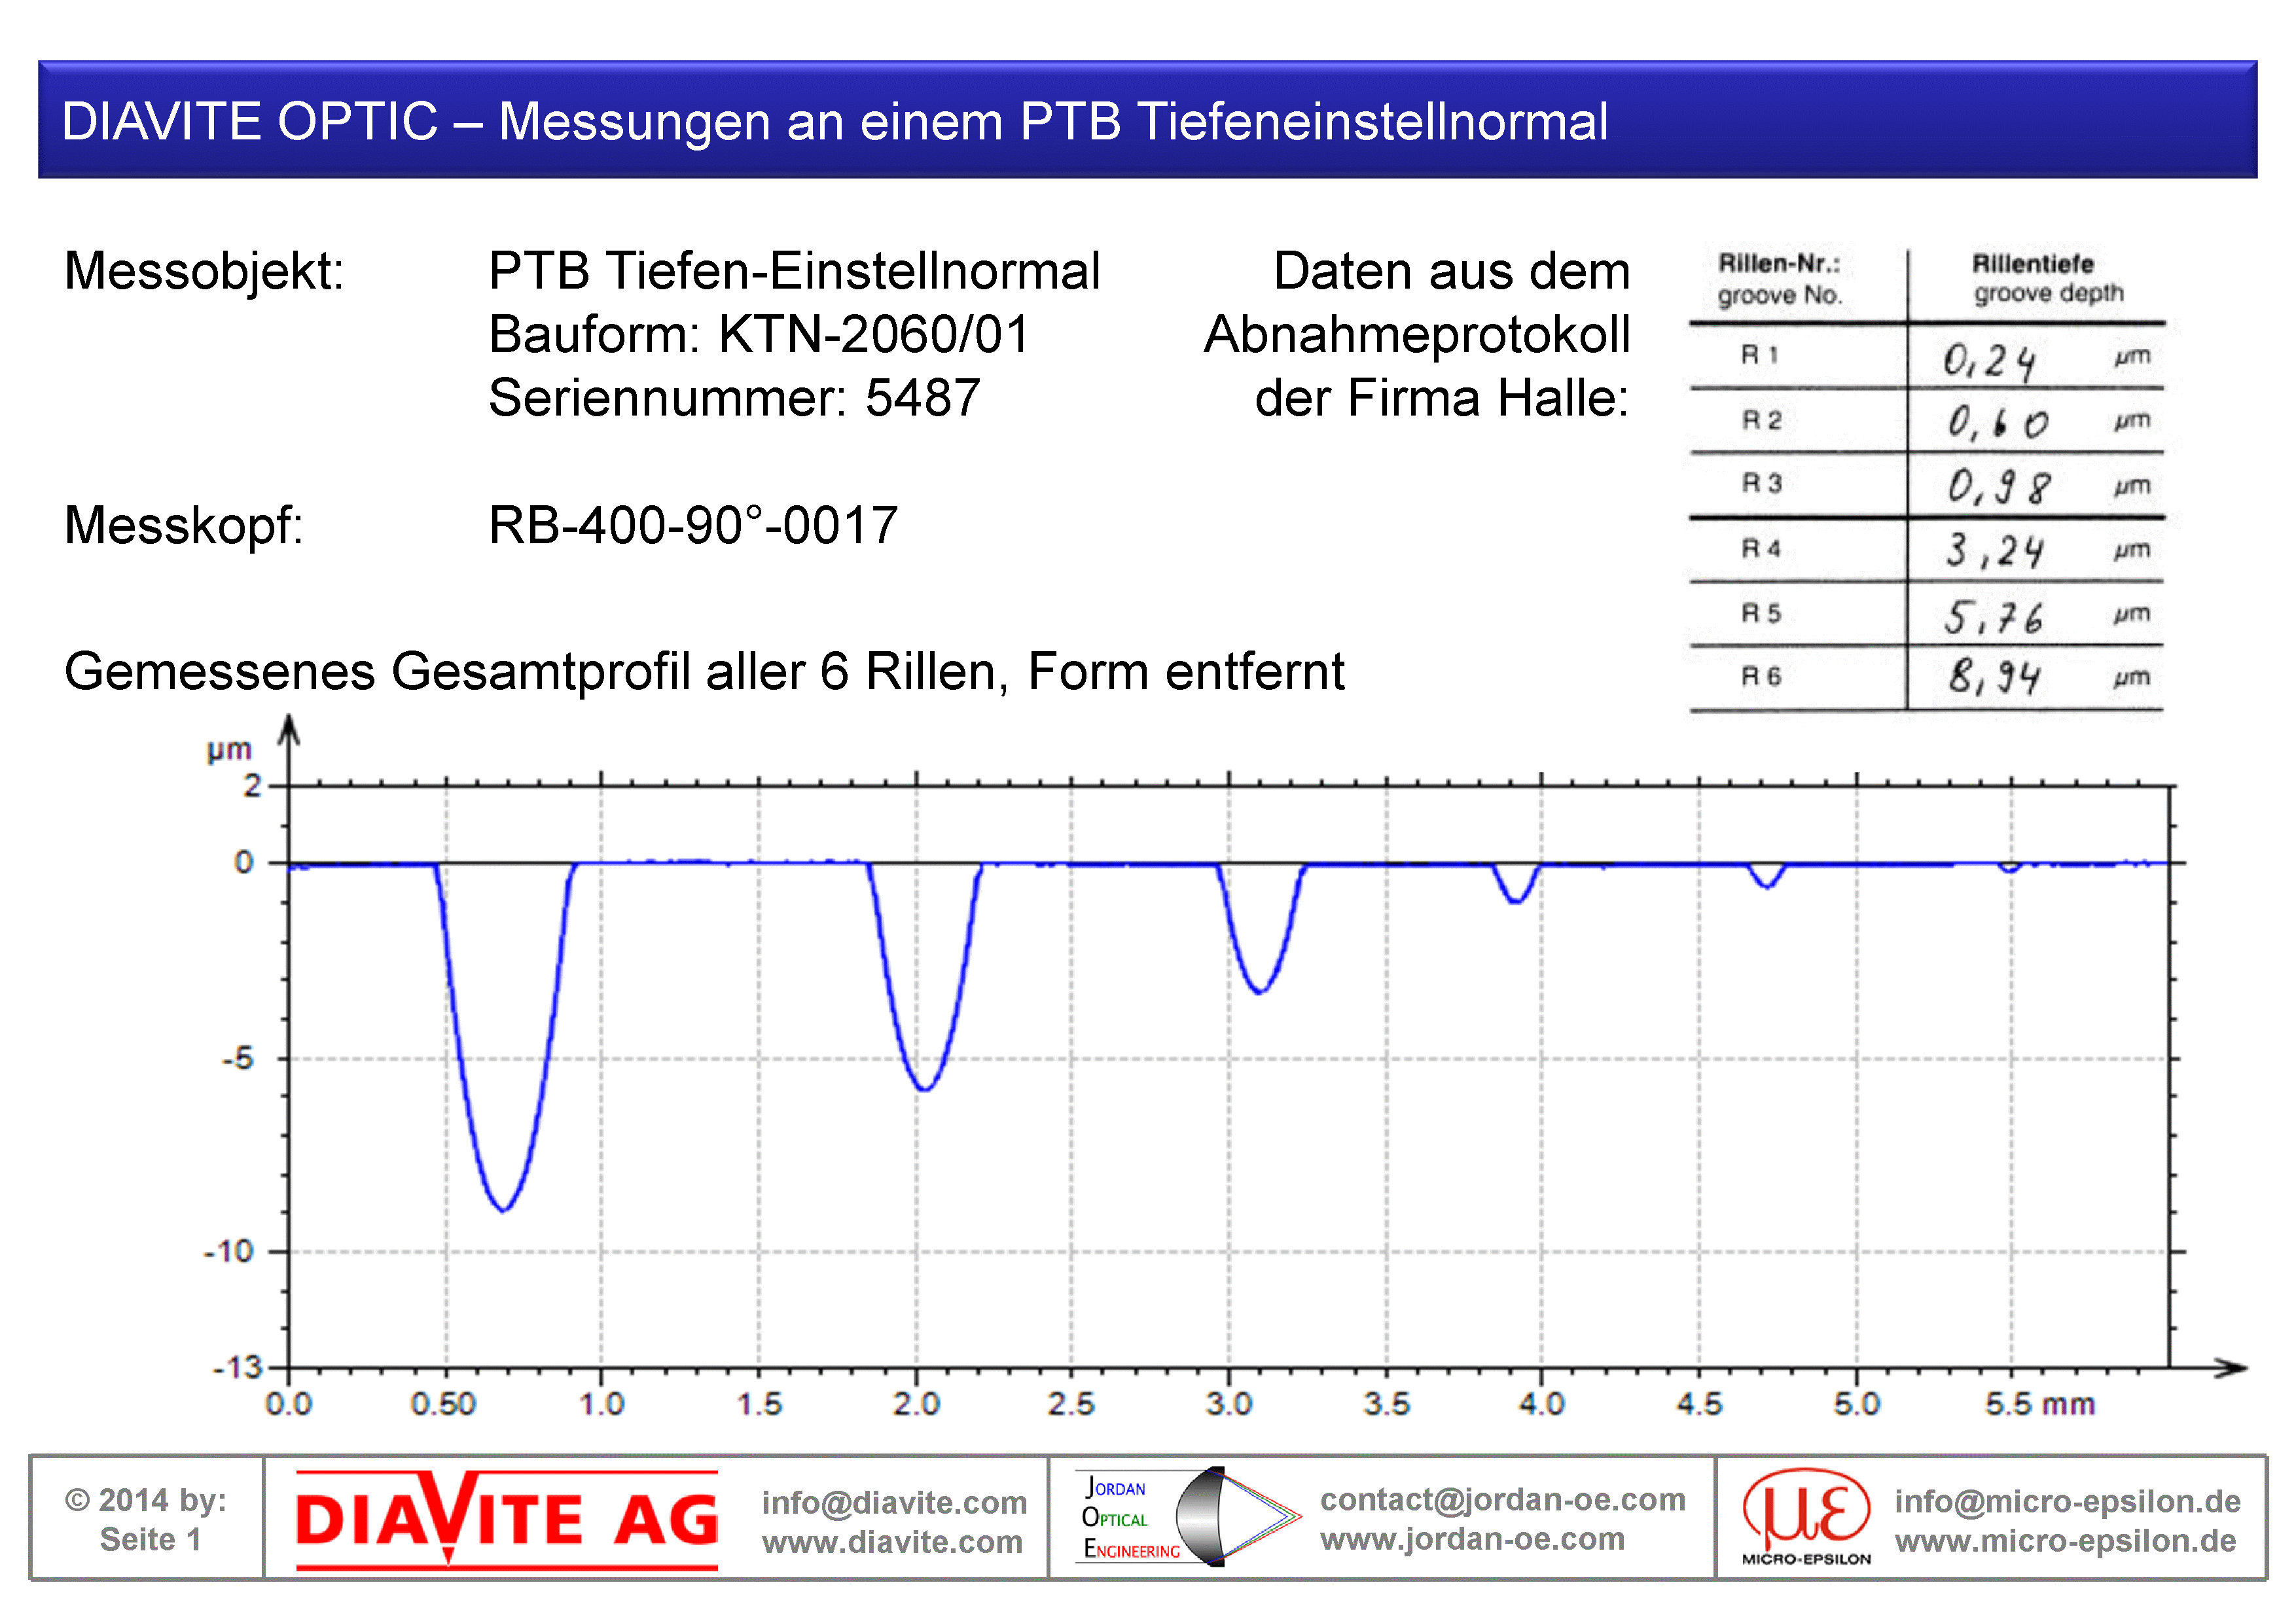
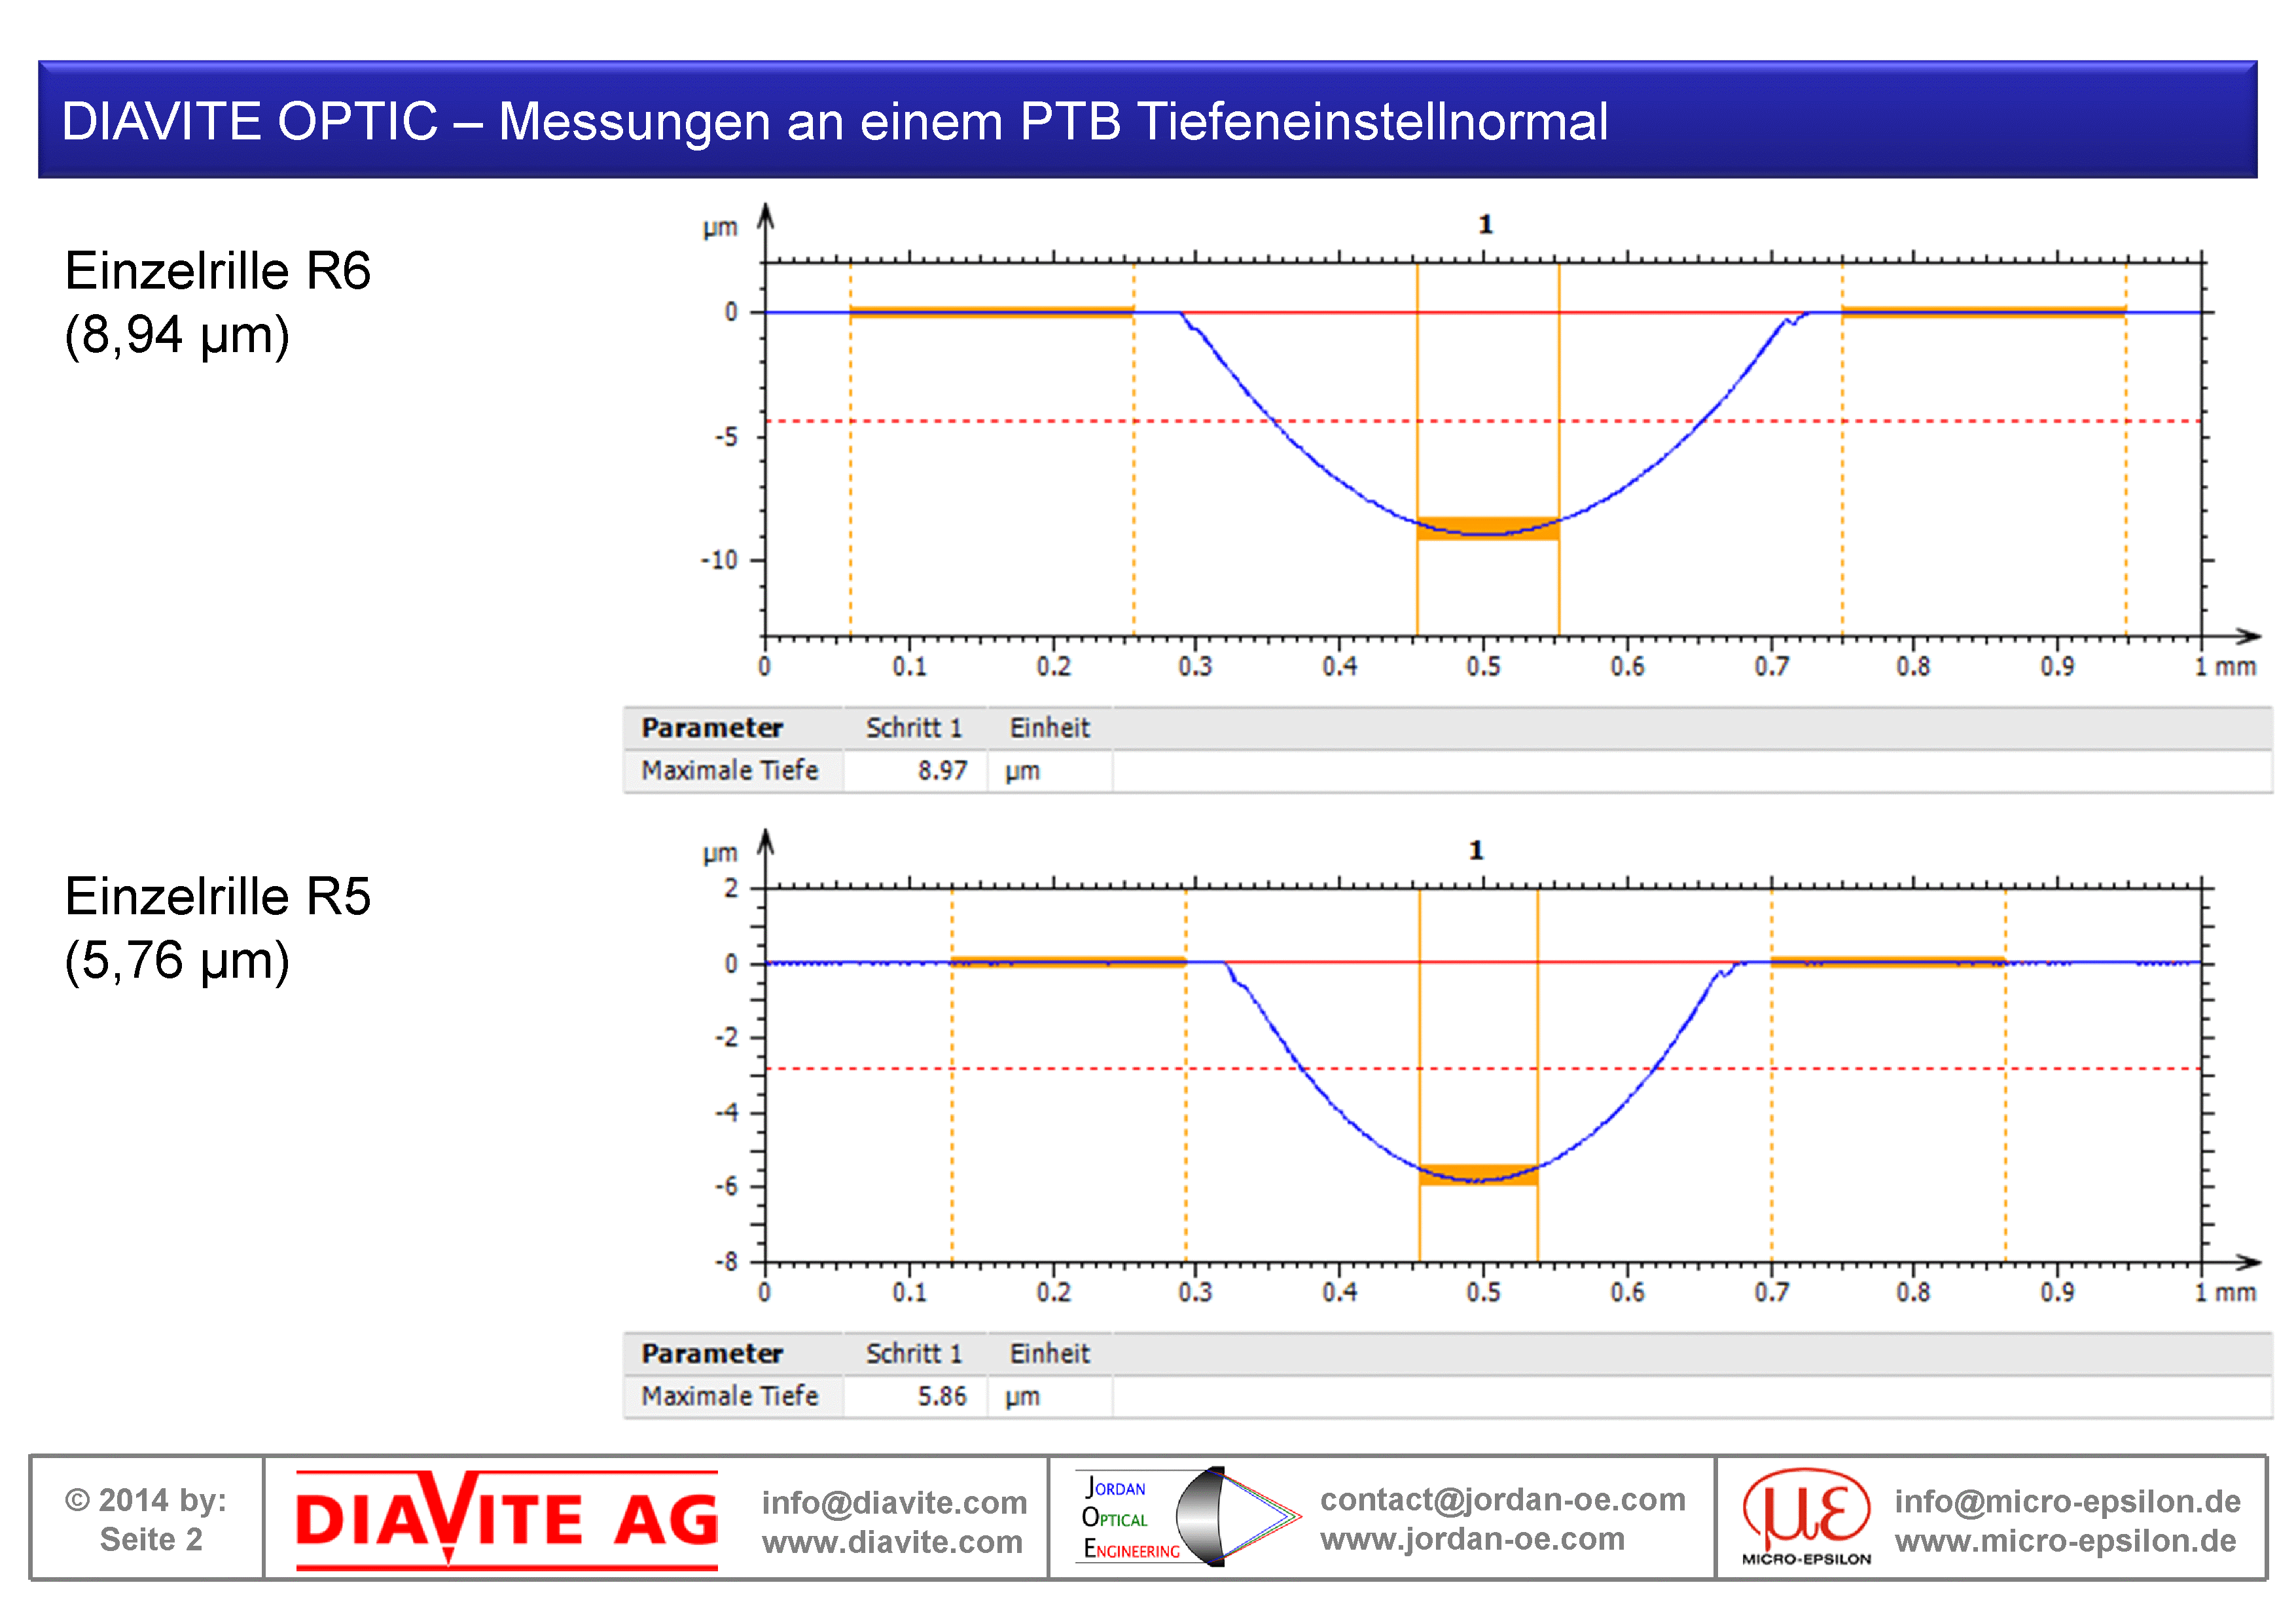
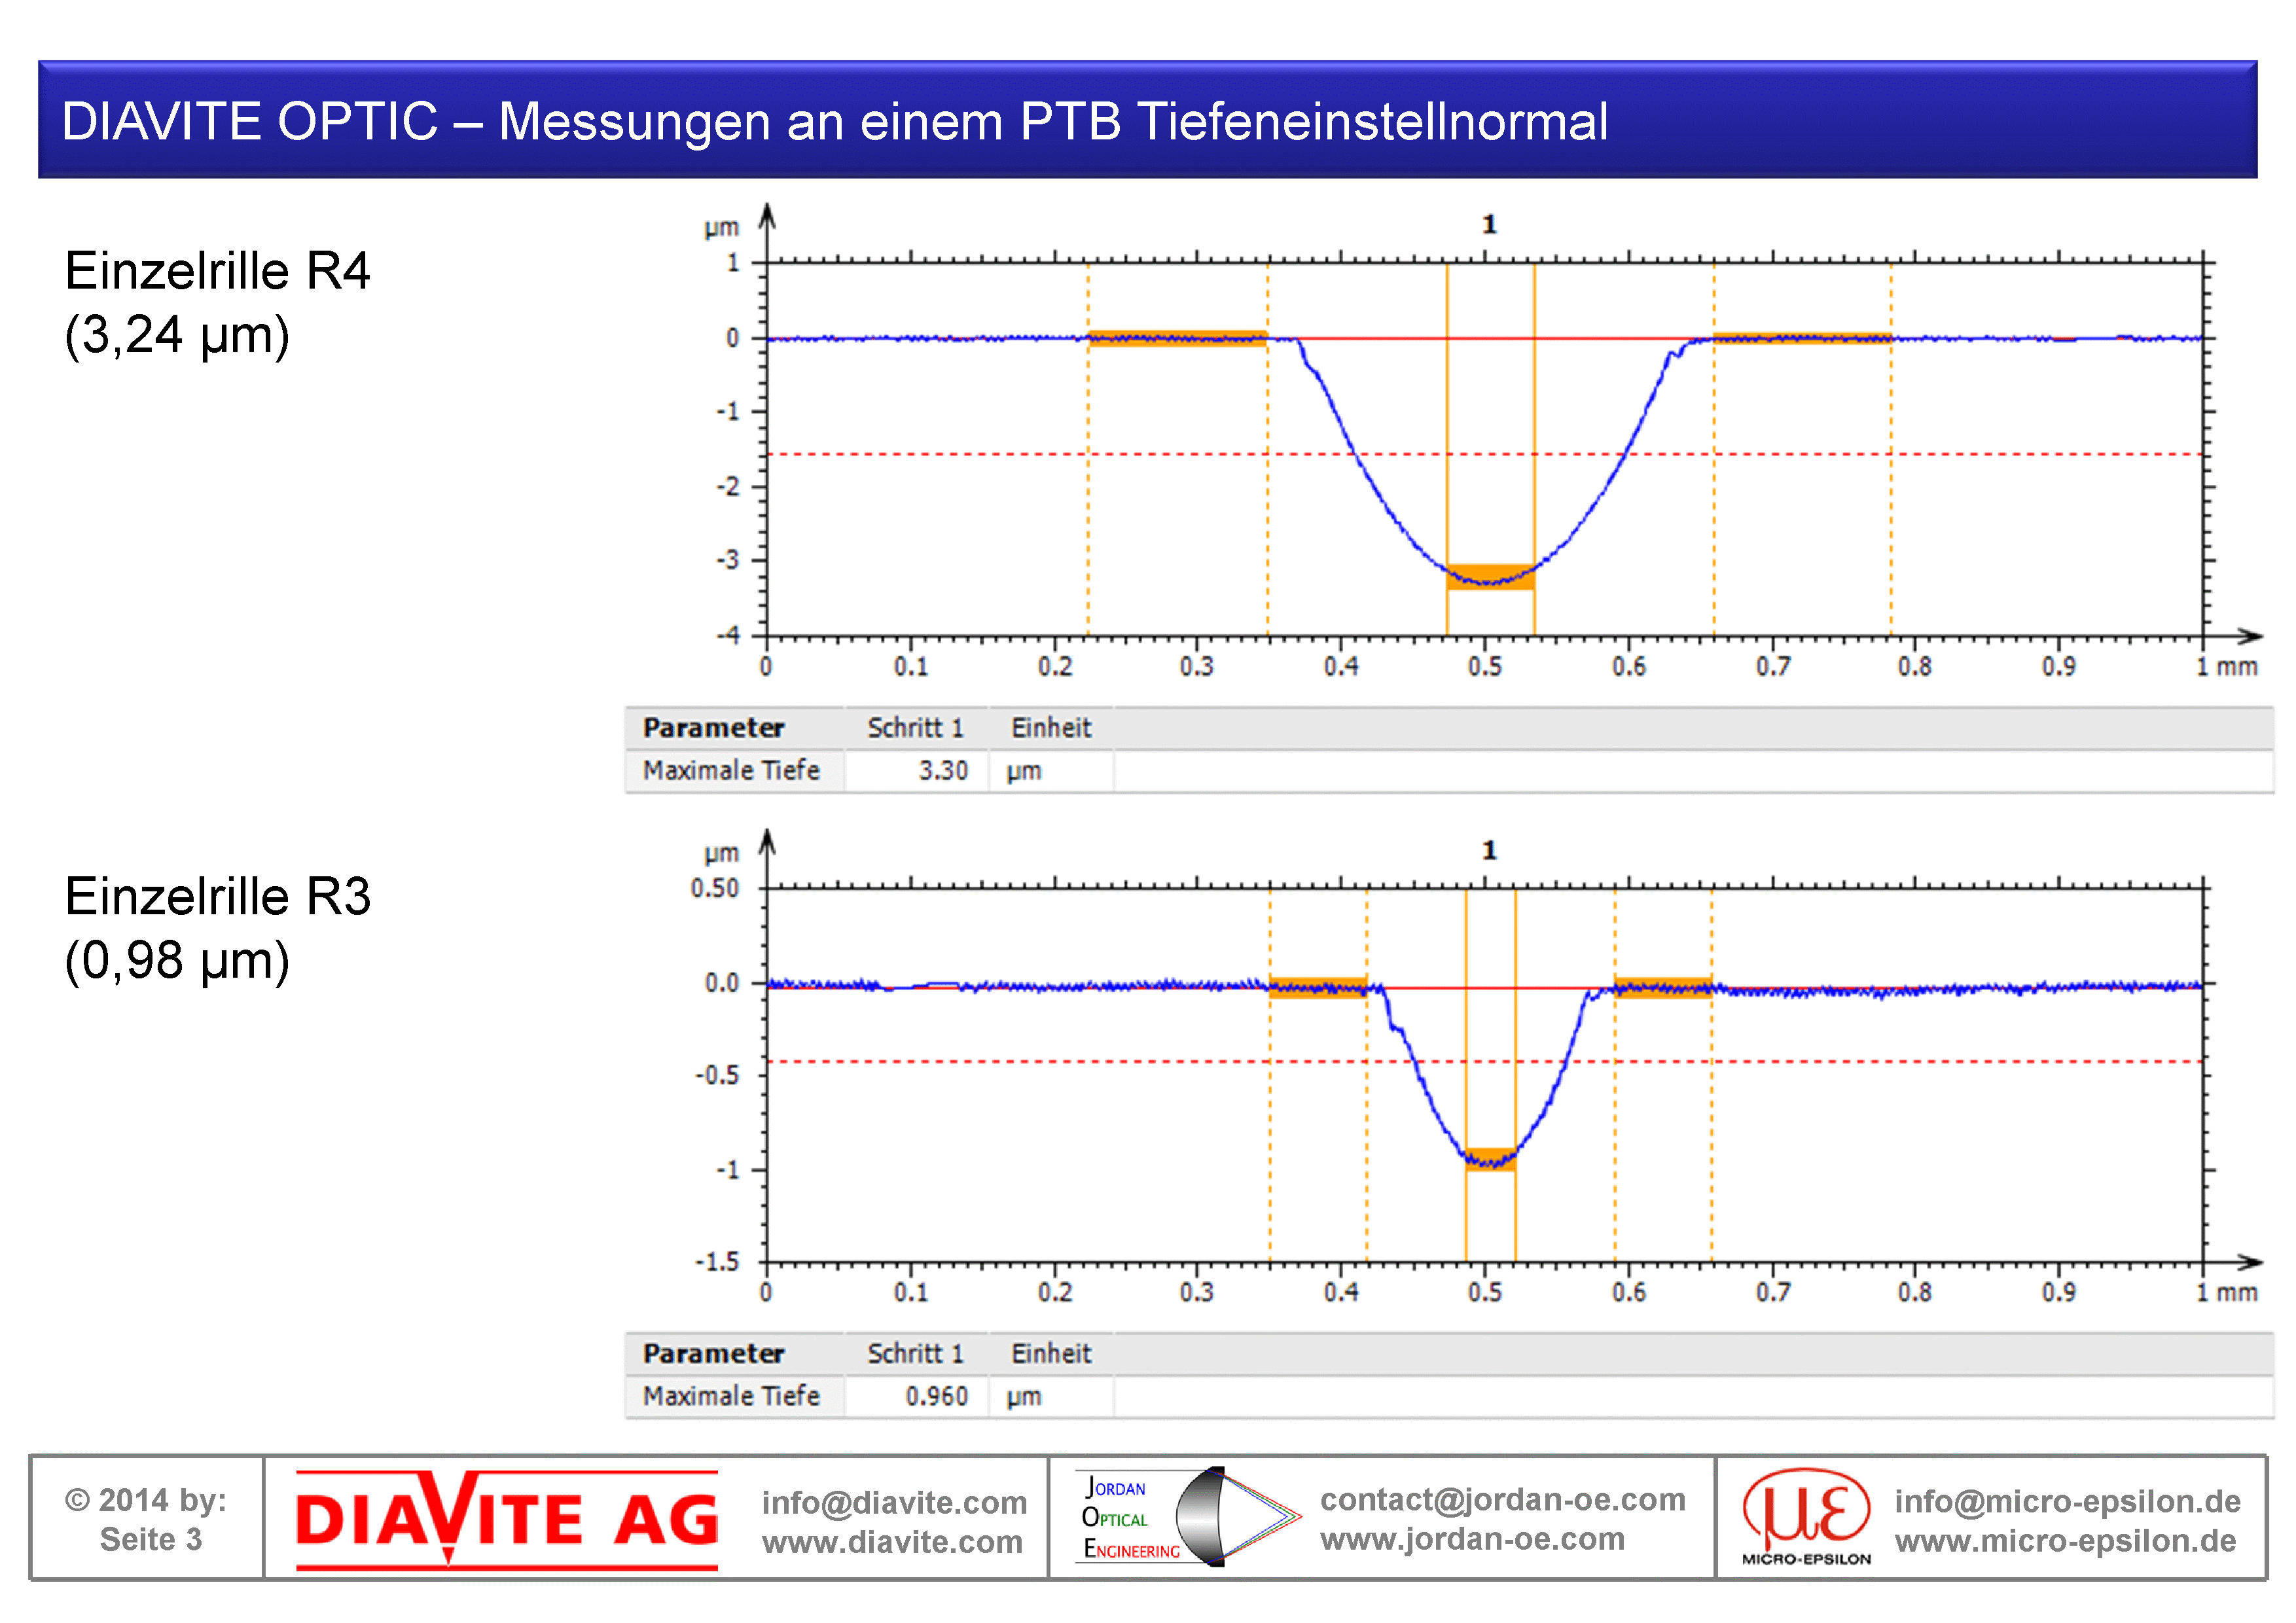
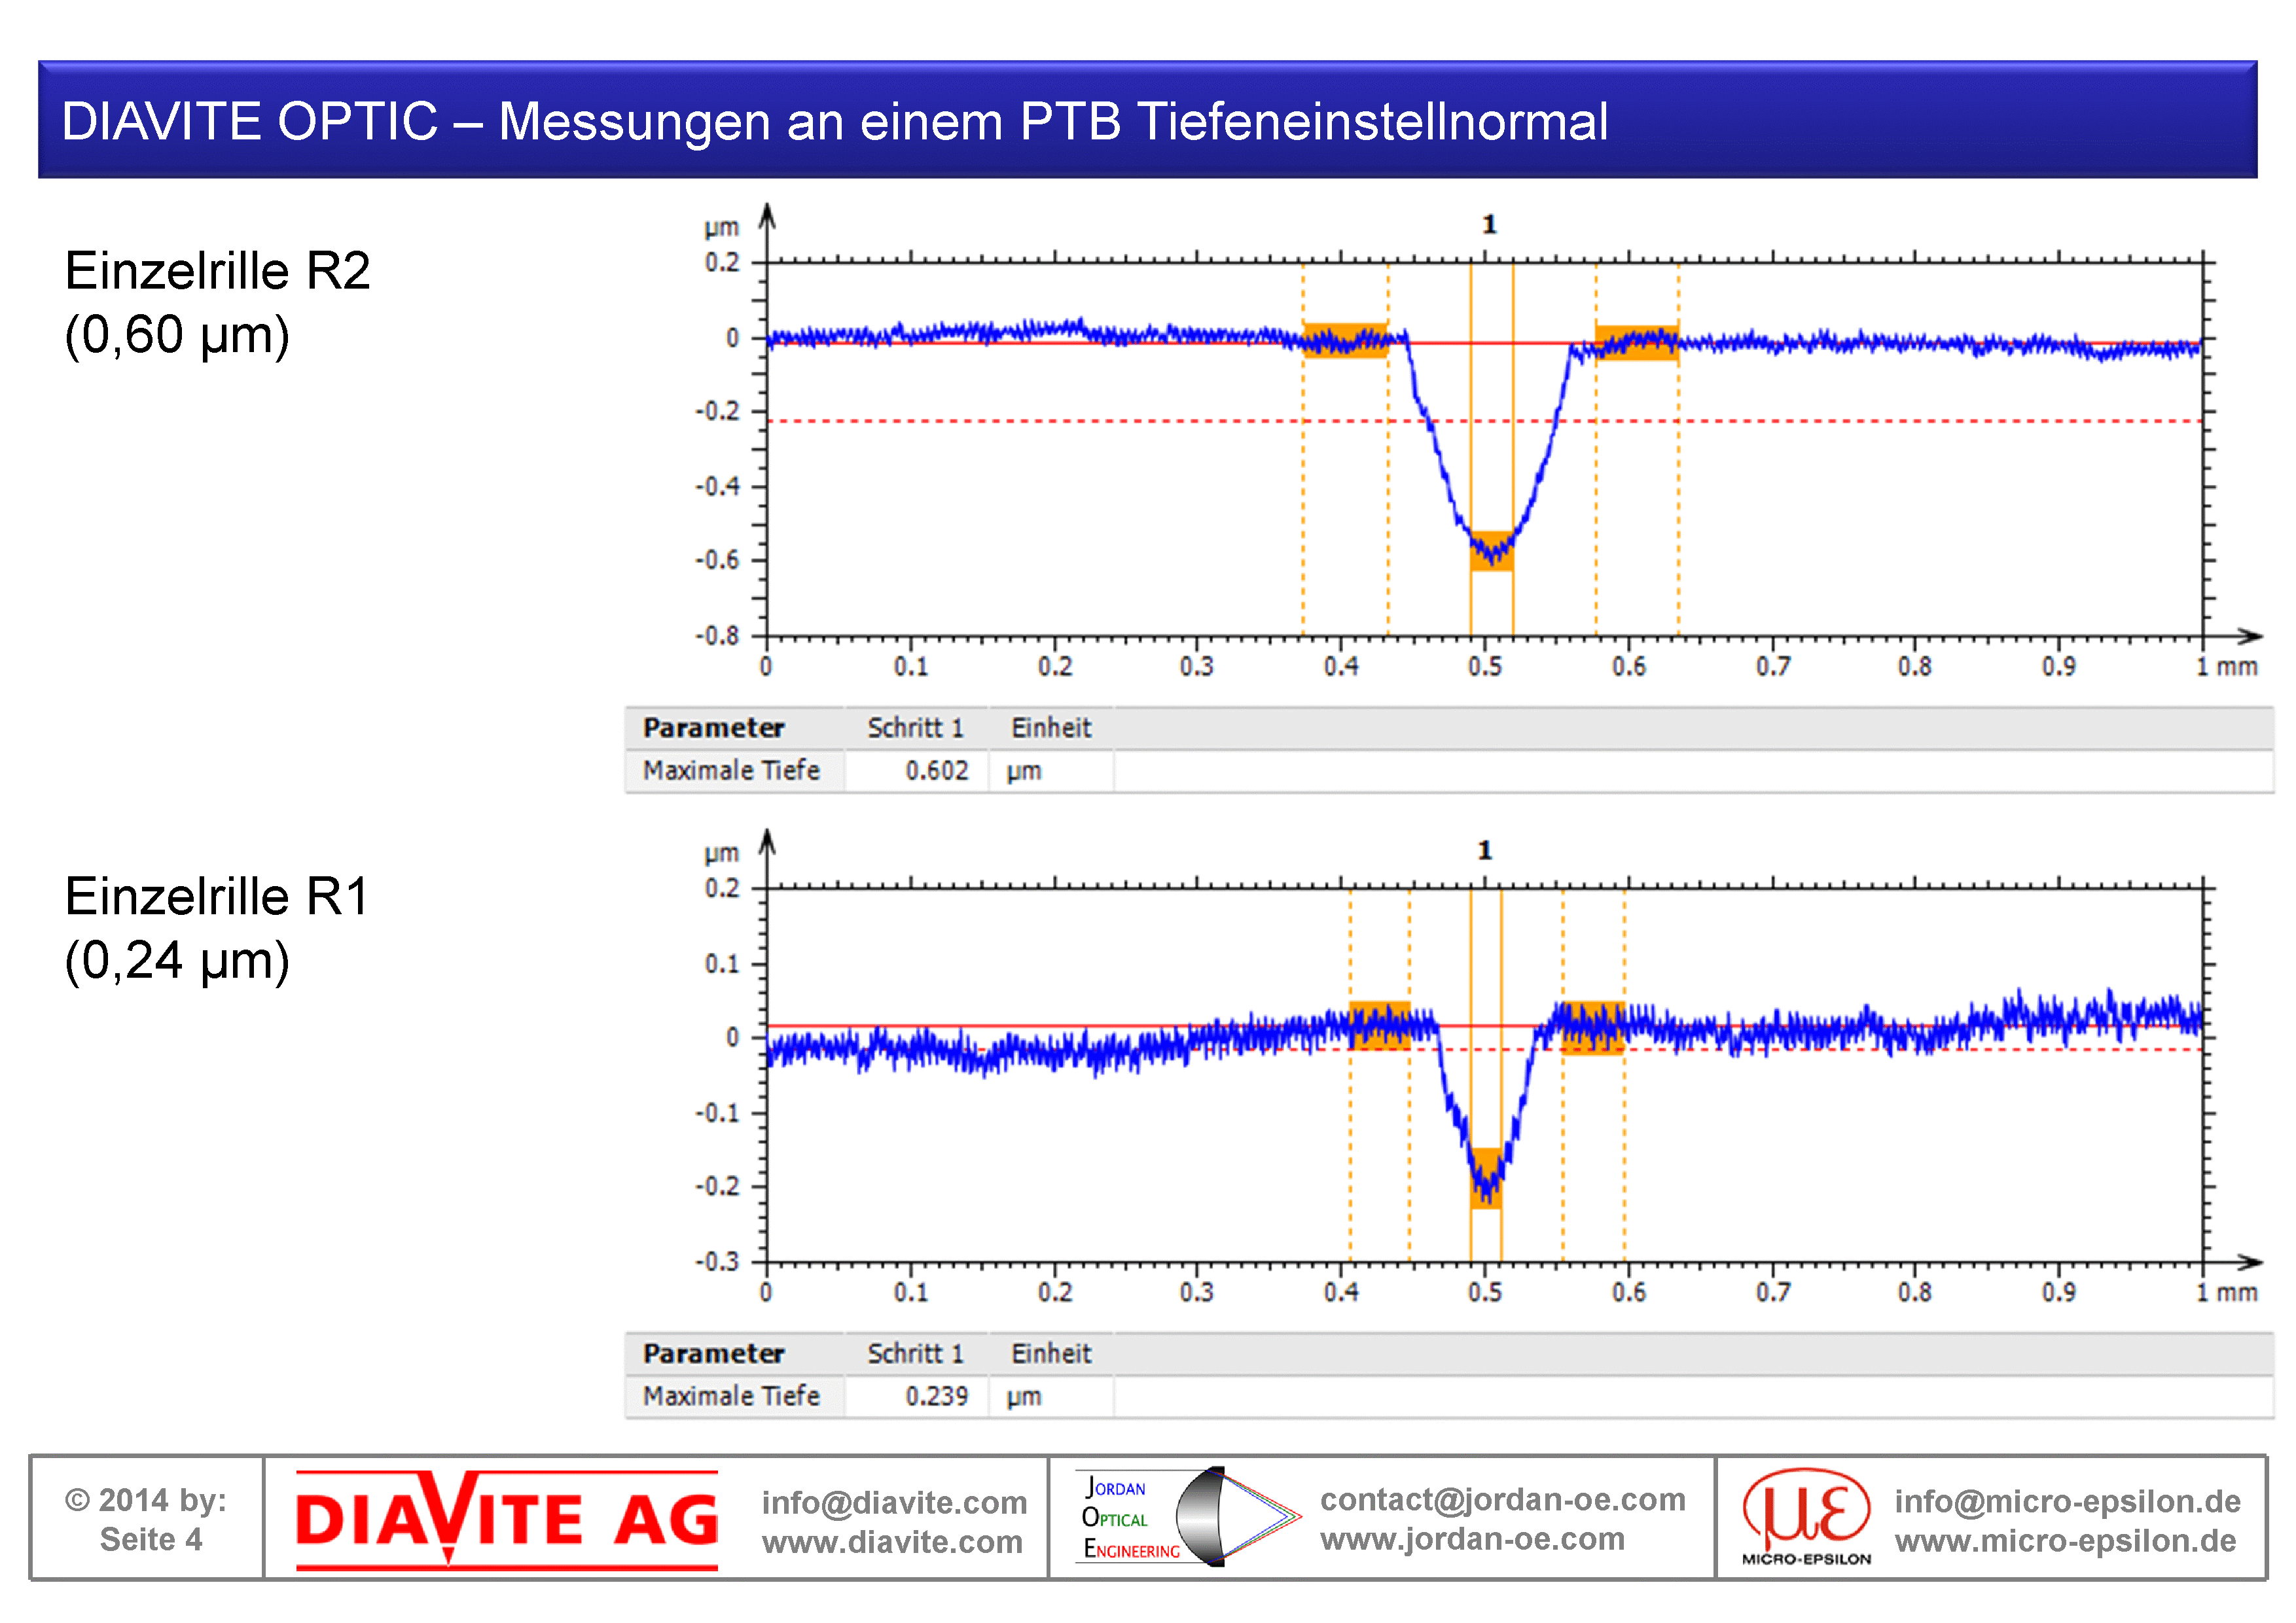
PTB-TE-4060
The left image shows the overall optical measurement on the PTB depth setting standard. Images 2-4 show detail enlargements of the various grooves.
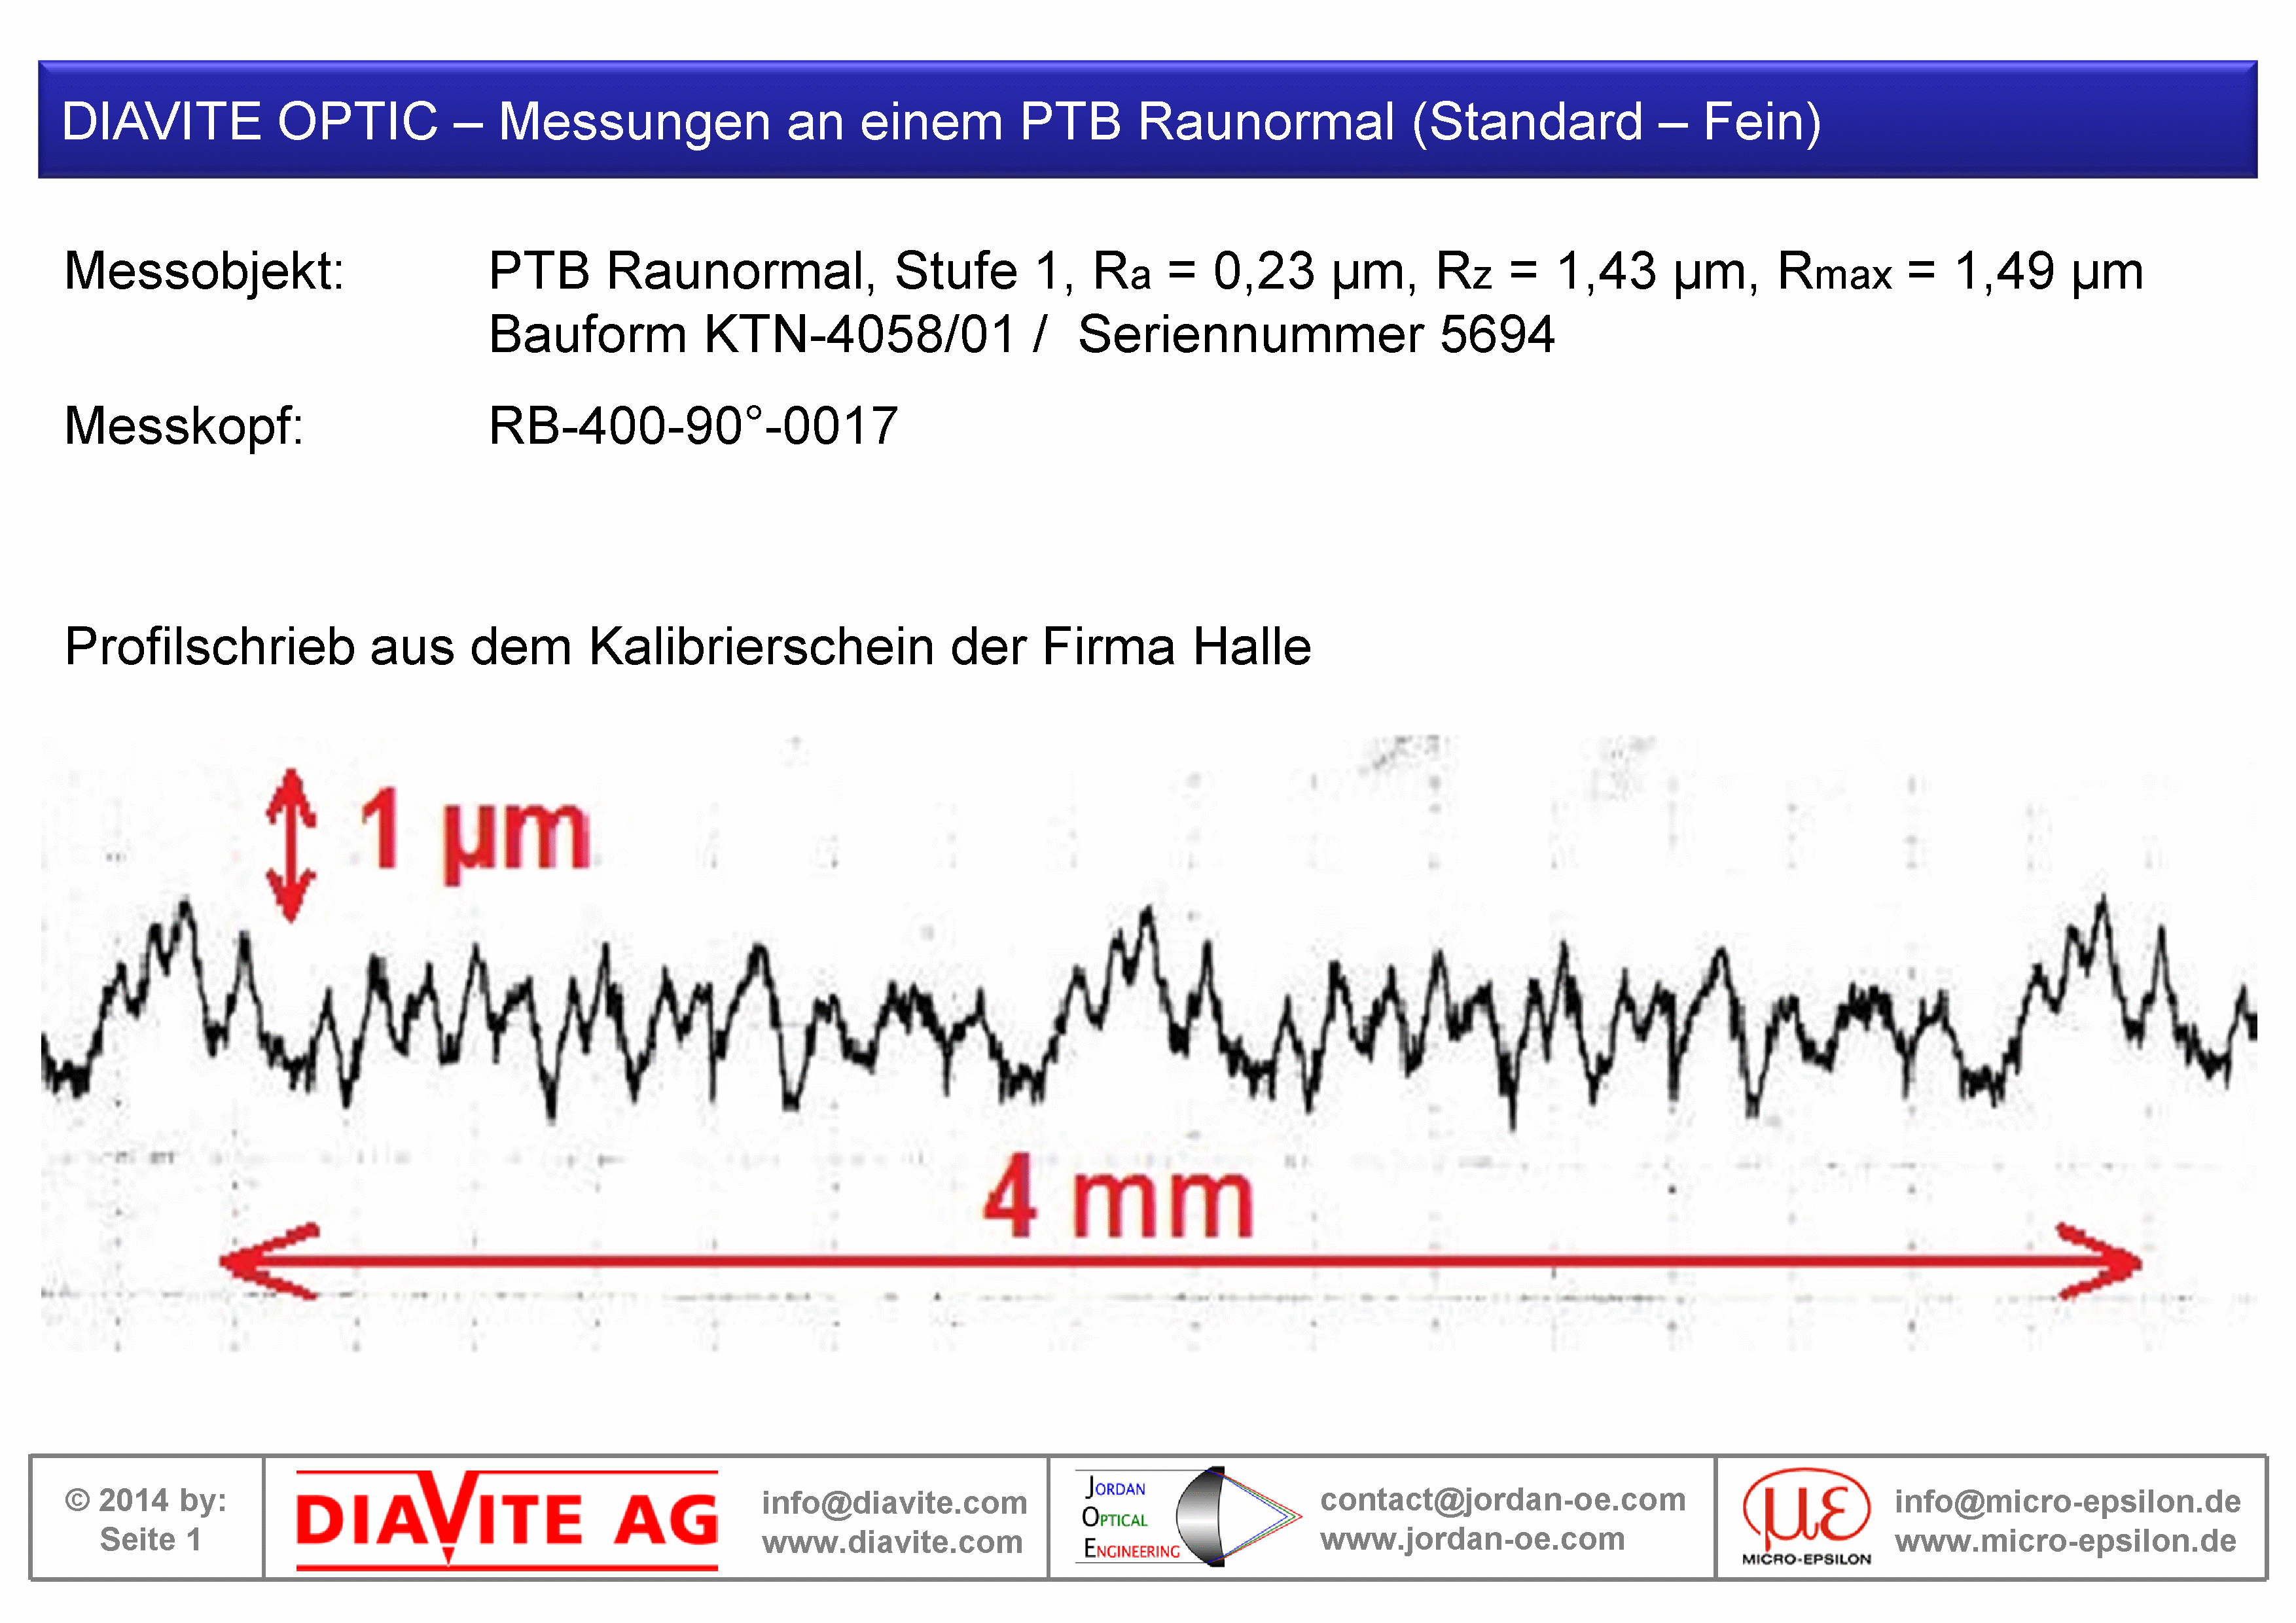
PTB-RN-4058/01 Stage 1
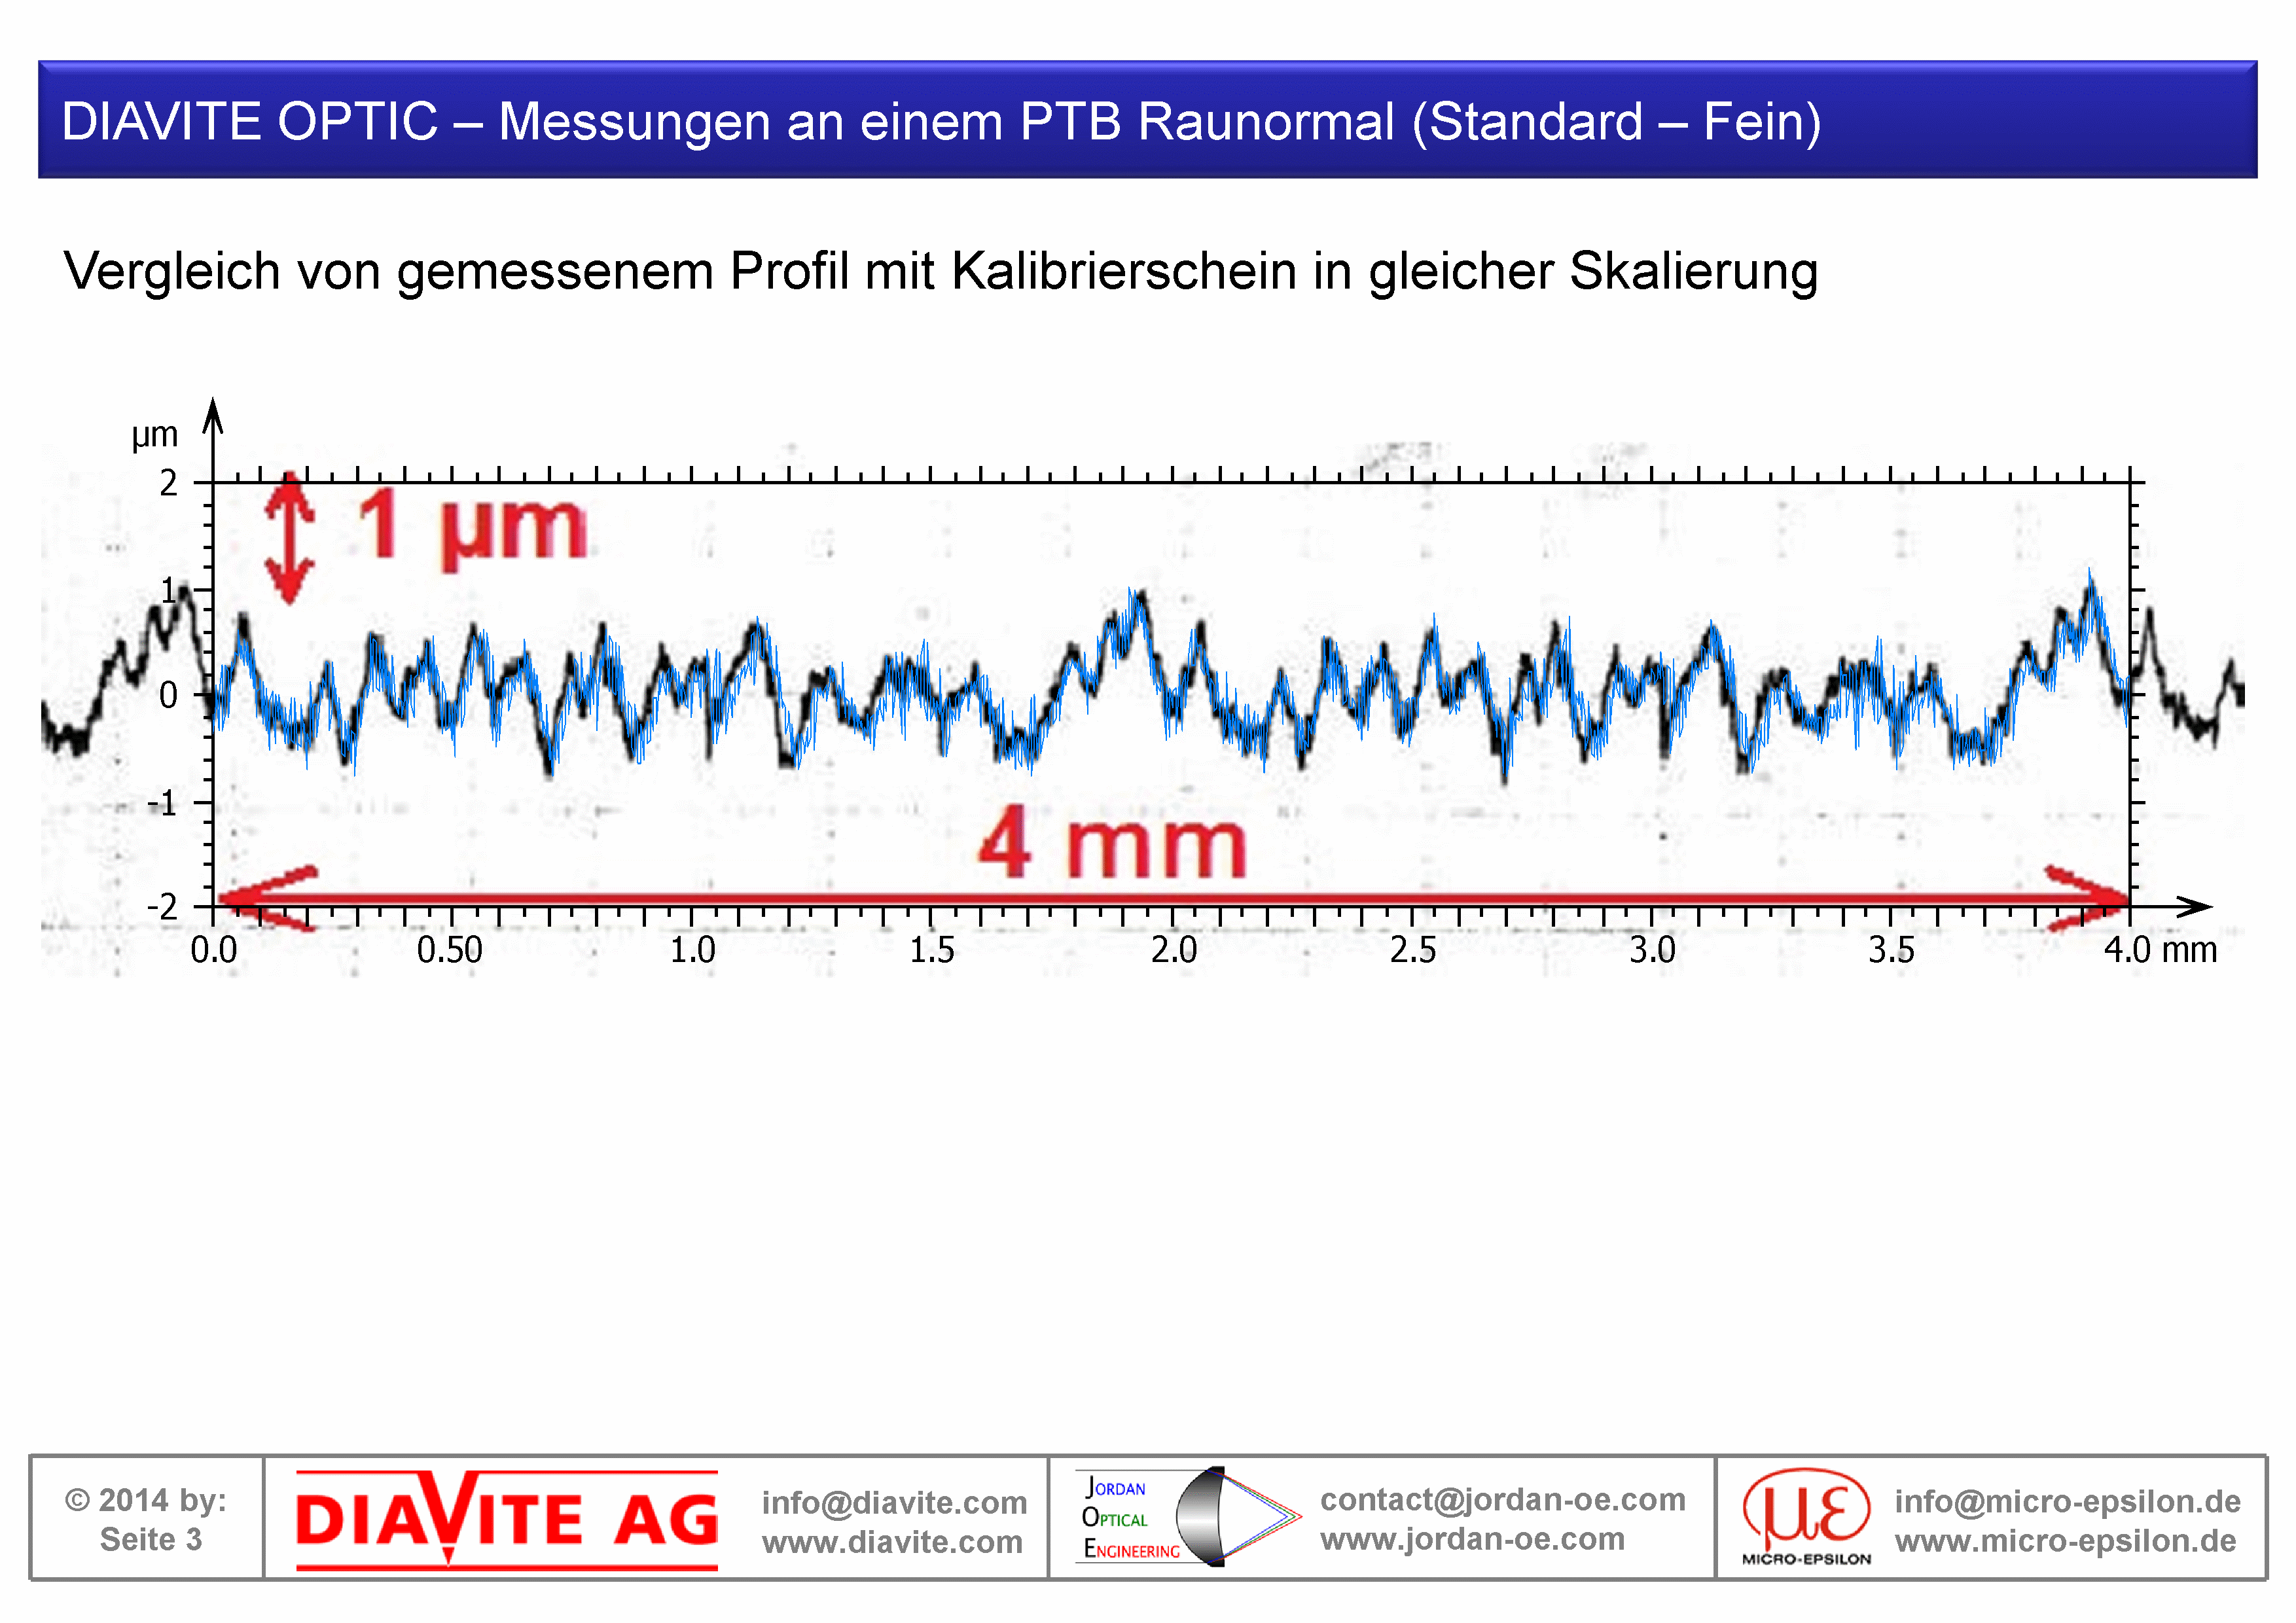
Comparison on a PTB Roughness Standard 4058/01 Level 1 (Ra = 0.23 µm). The left image shows the tactile reference measurement. The middle image shows the optical comparison measurement and the right image the superposition of both profiles.
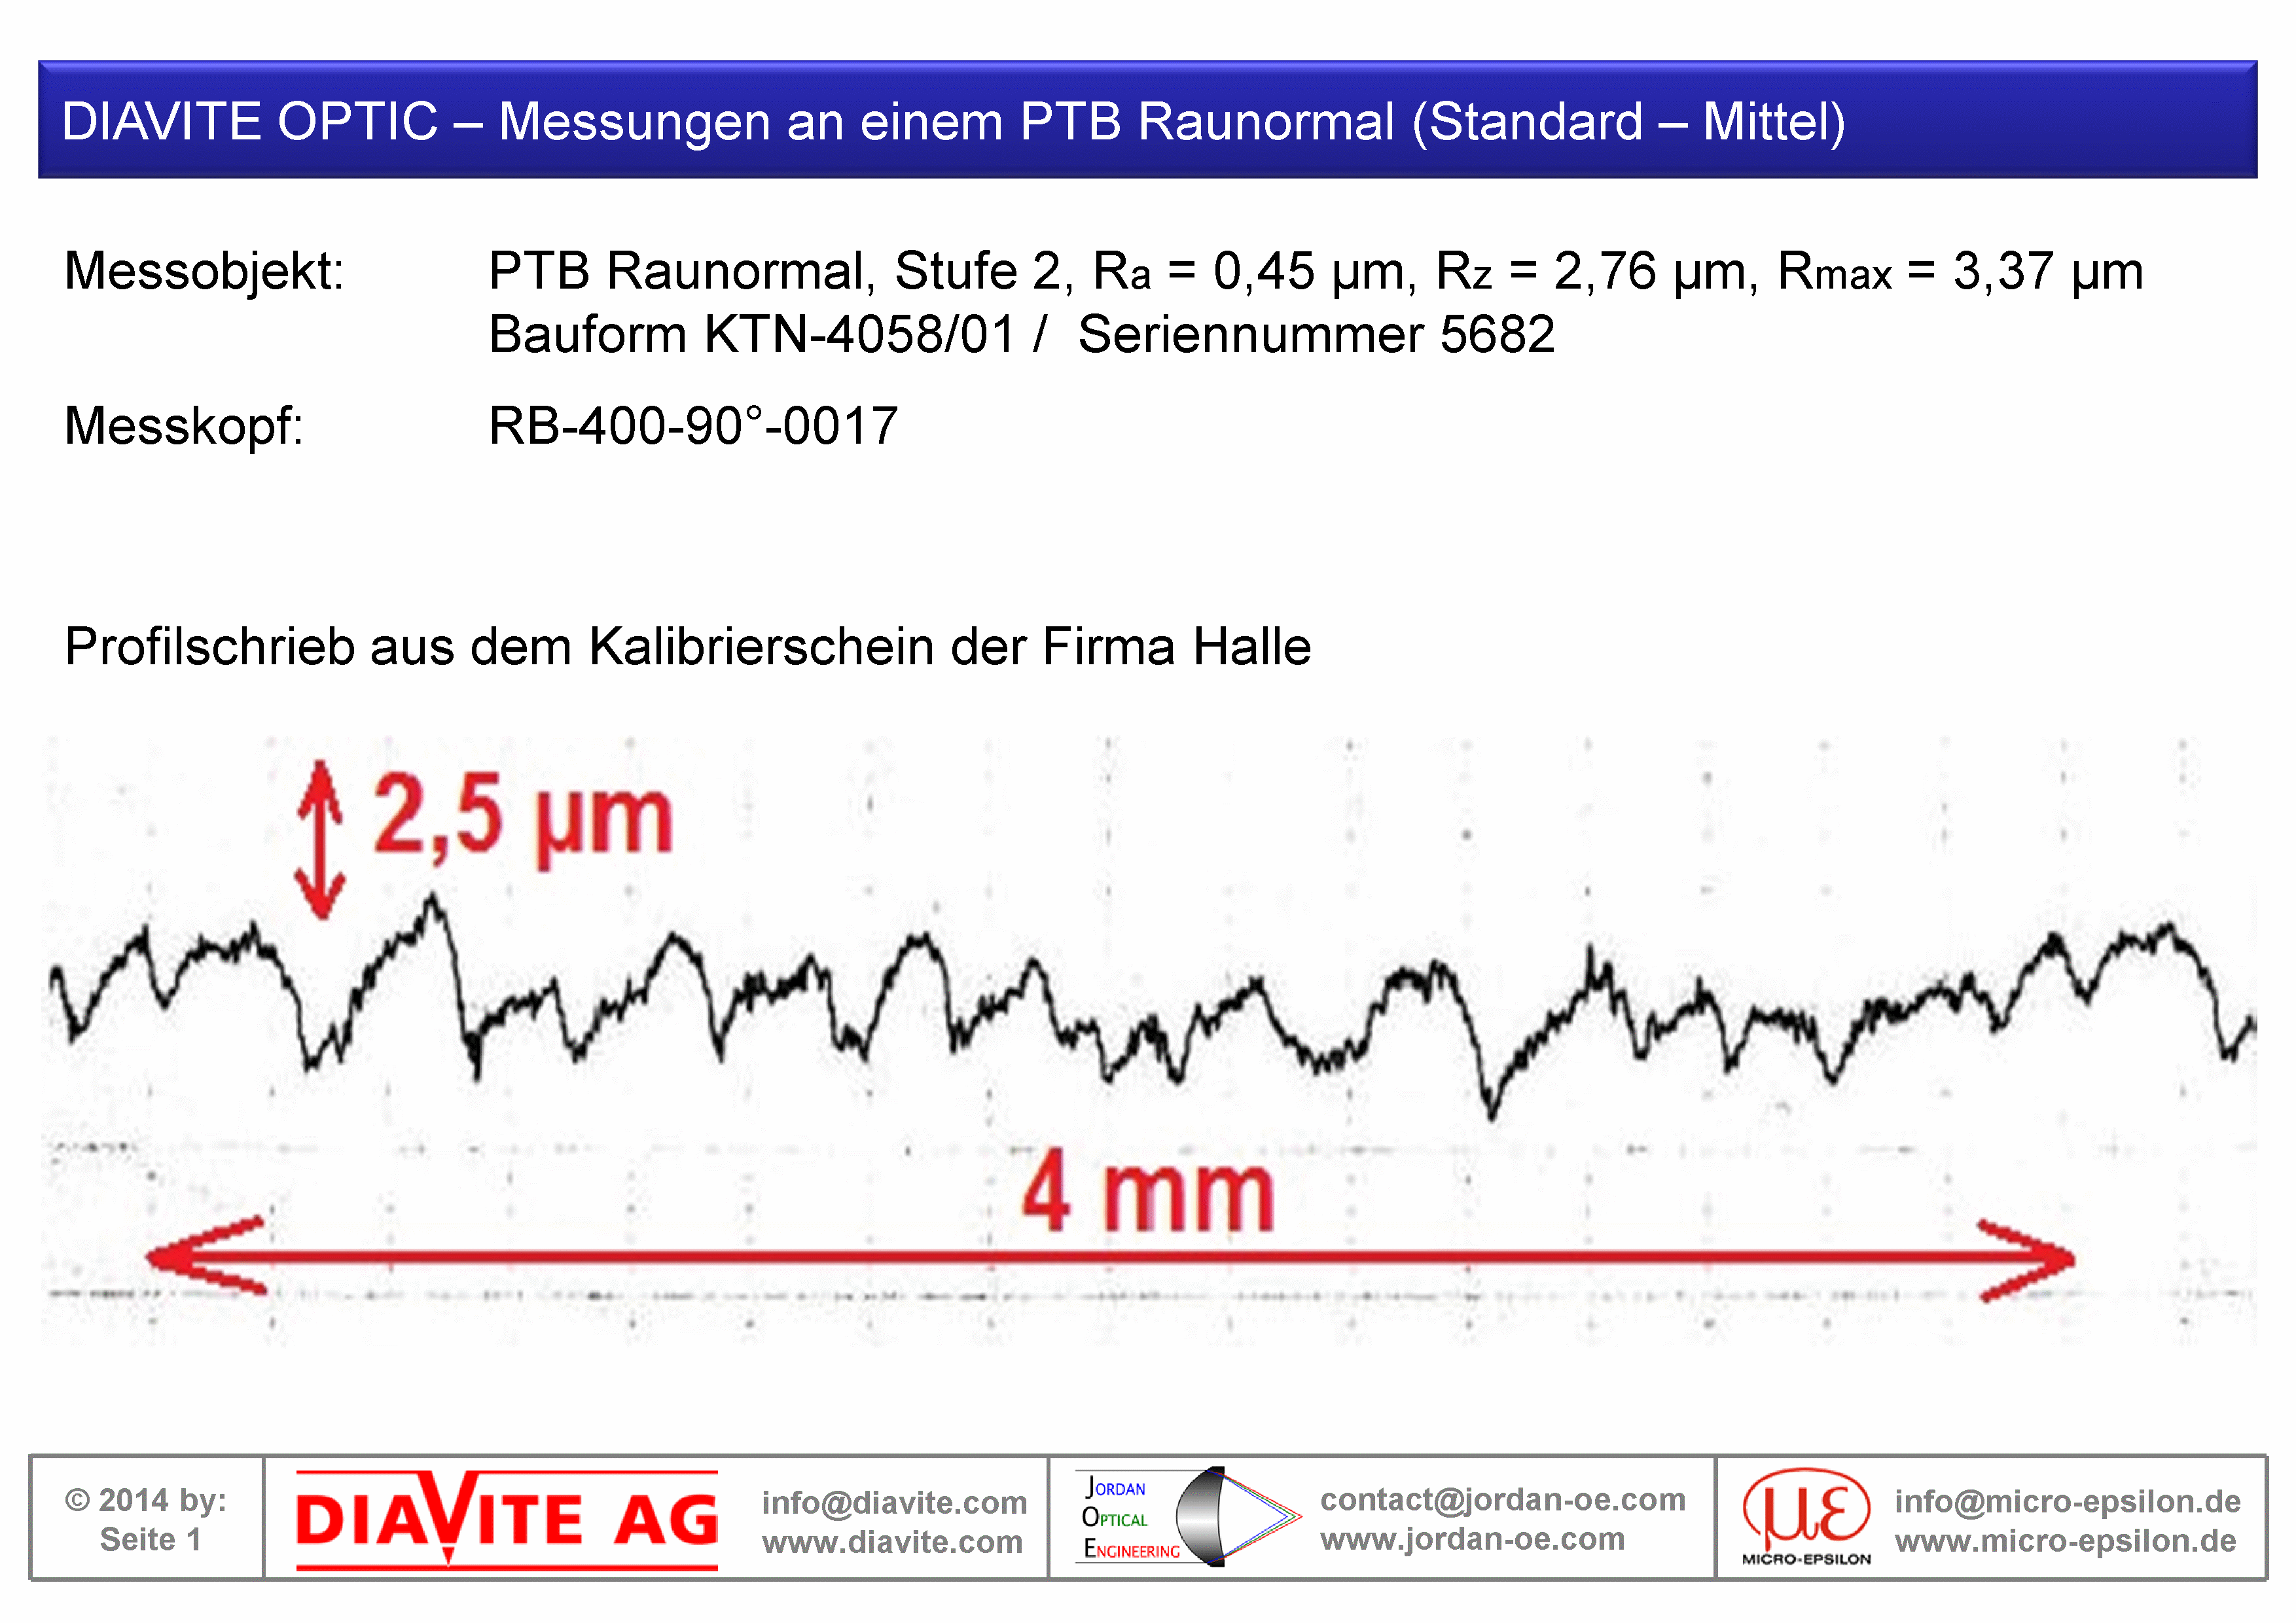
PTB-RN-4058/01 Stage 2
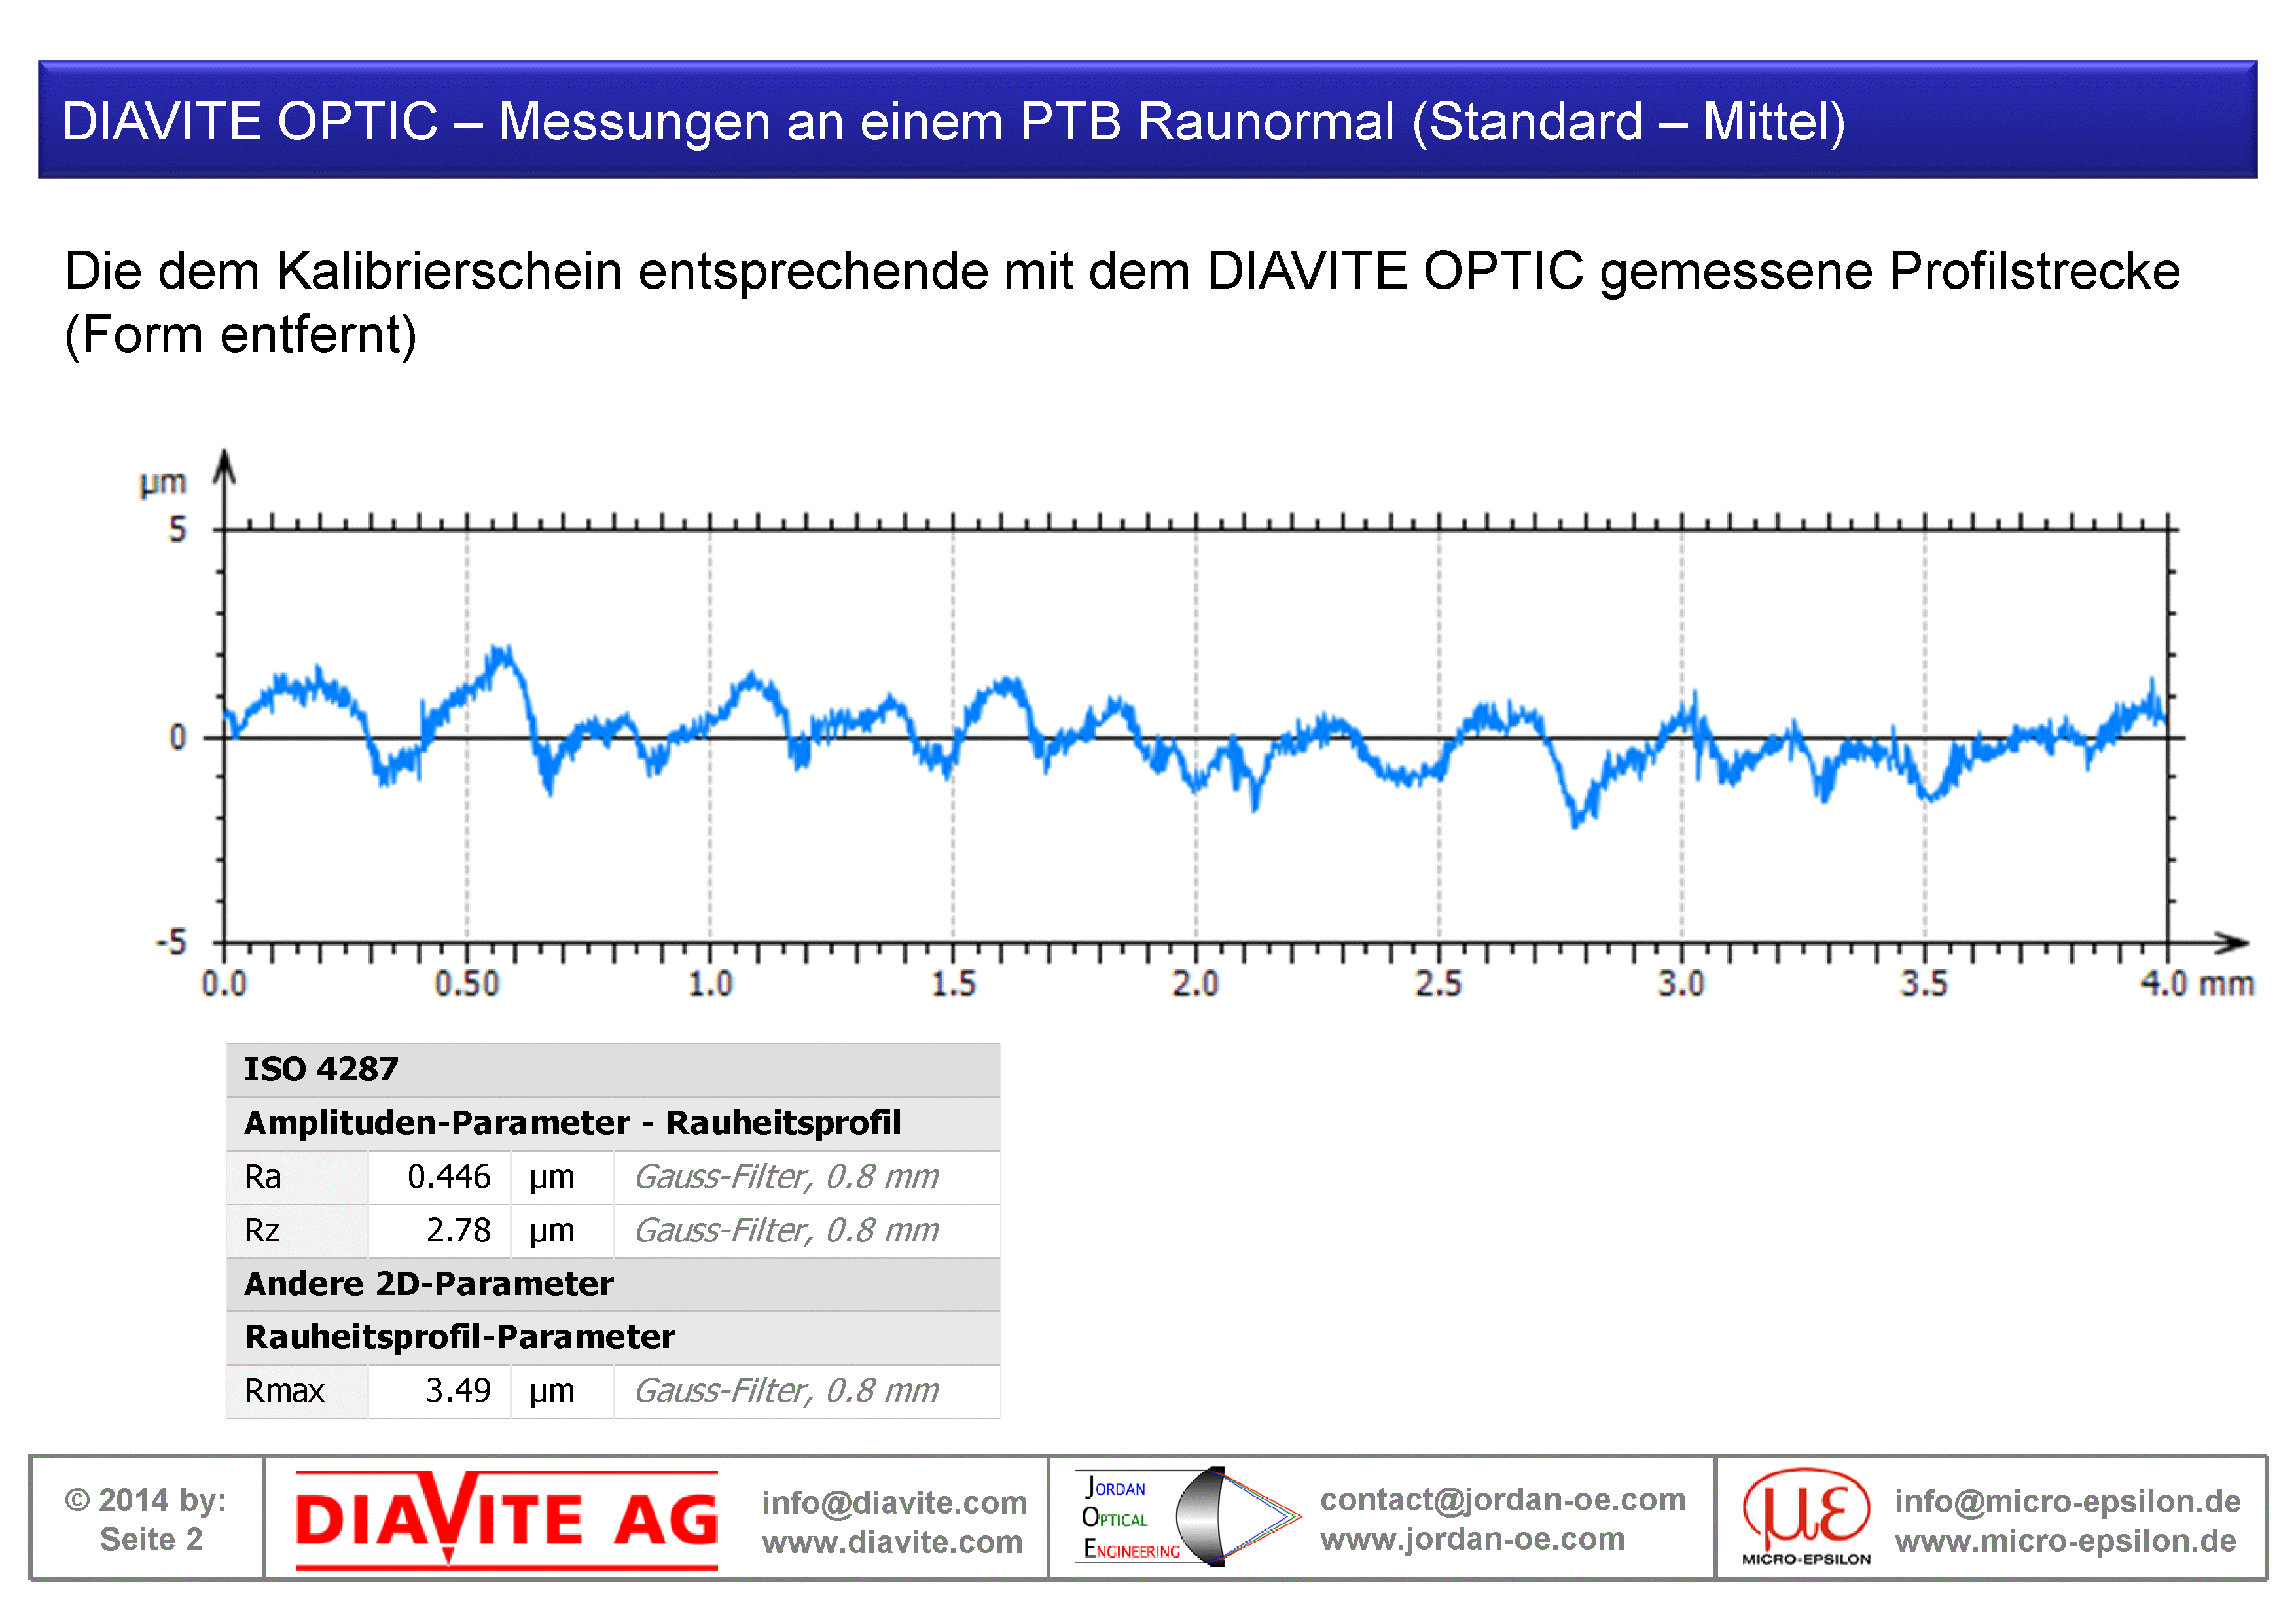
Comparison on a PTB Roughness Standard 4058/01 Level 2 (Ra = 0.45 µm). The left image shows the tactile reference measurement. The middle image shows the optical comparison measurement and the right image the superposition of both profiles.
PTB-RN-4058/01 Stage 3
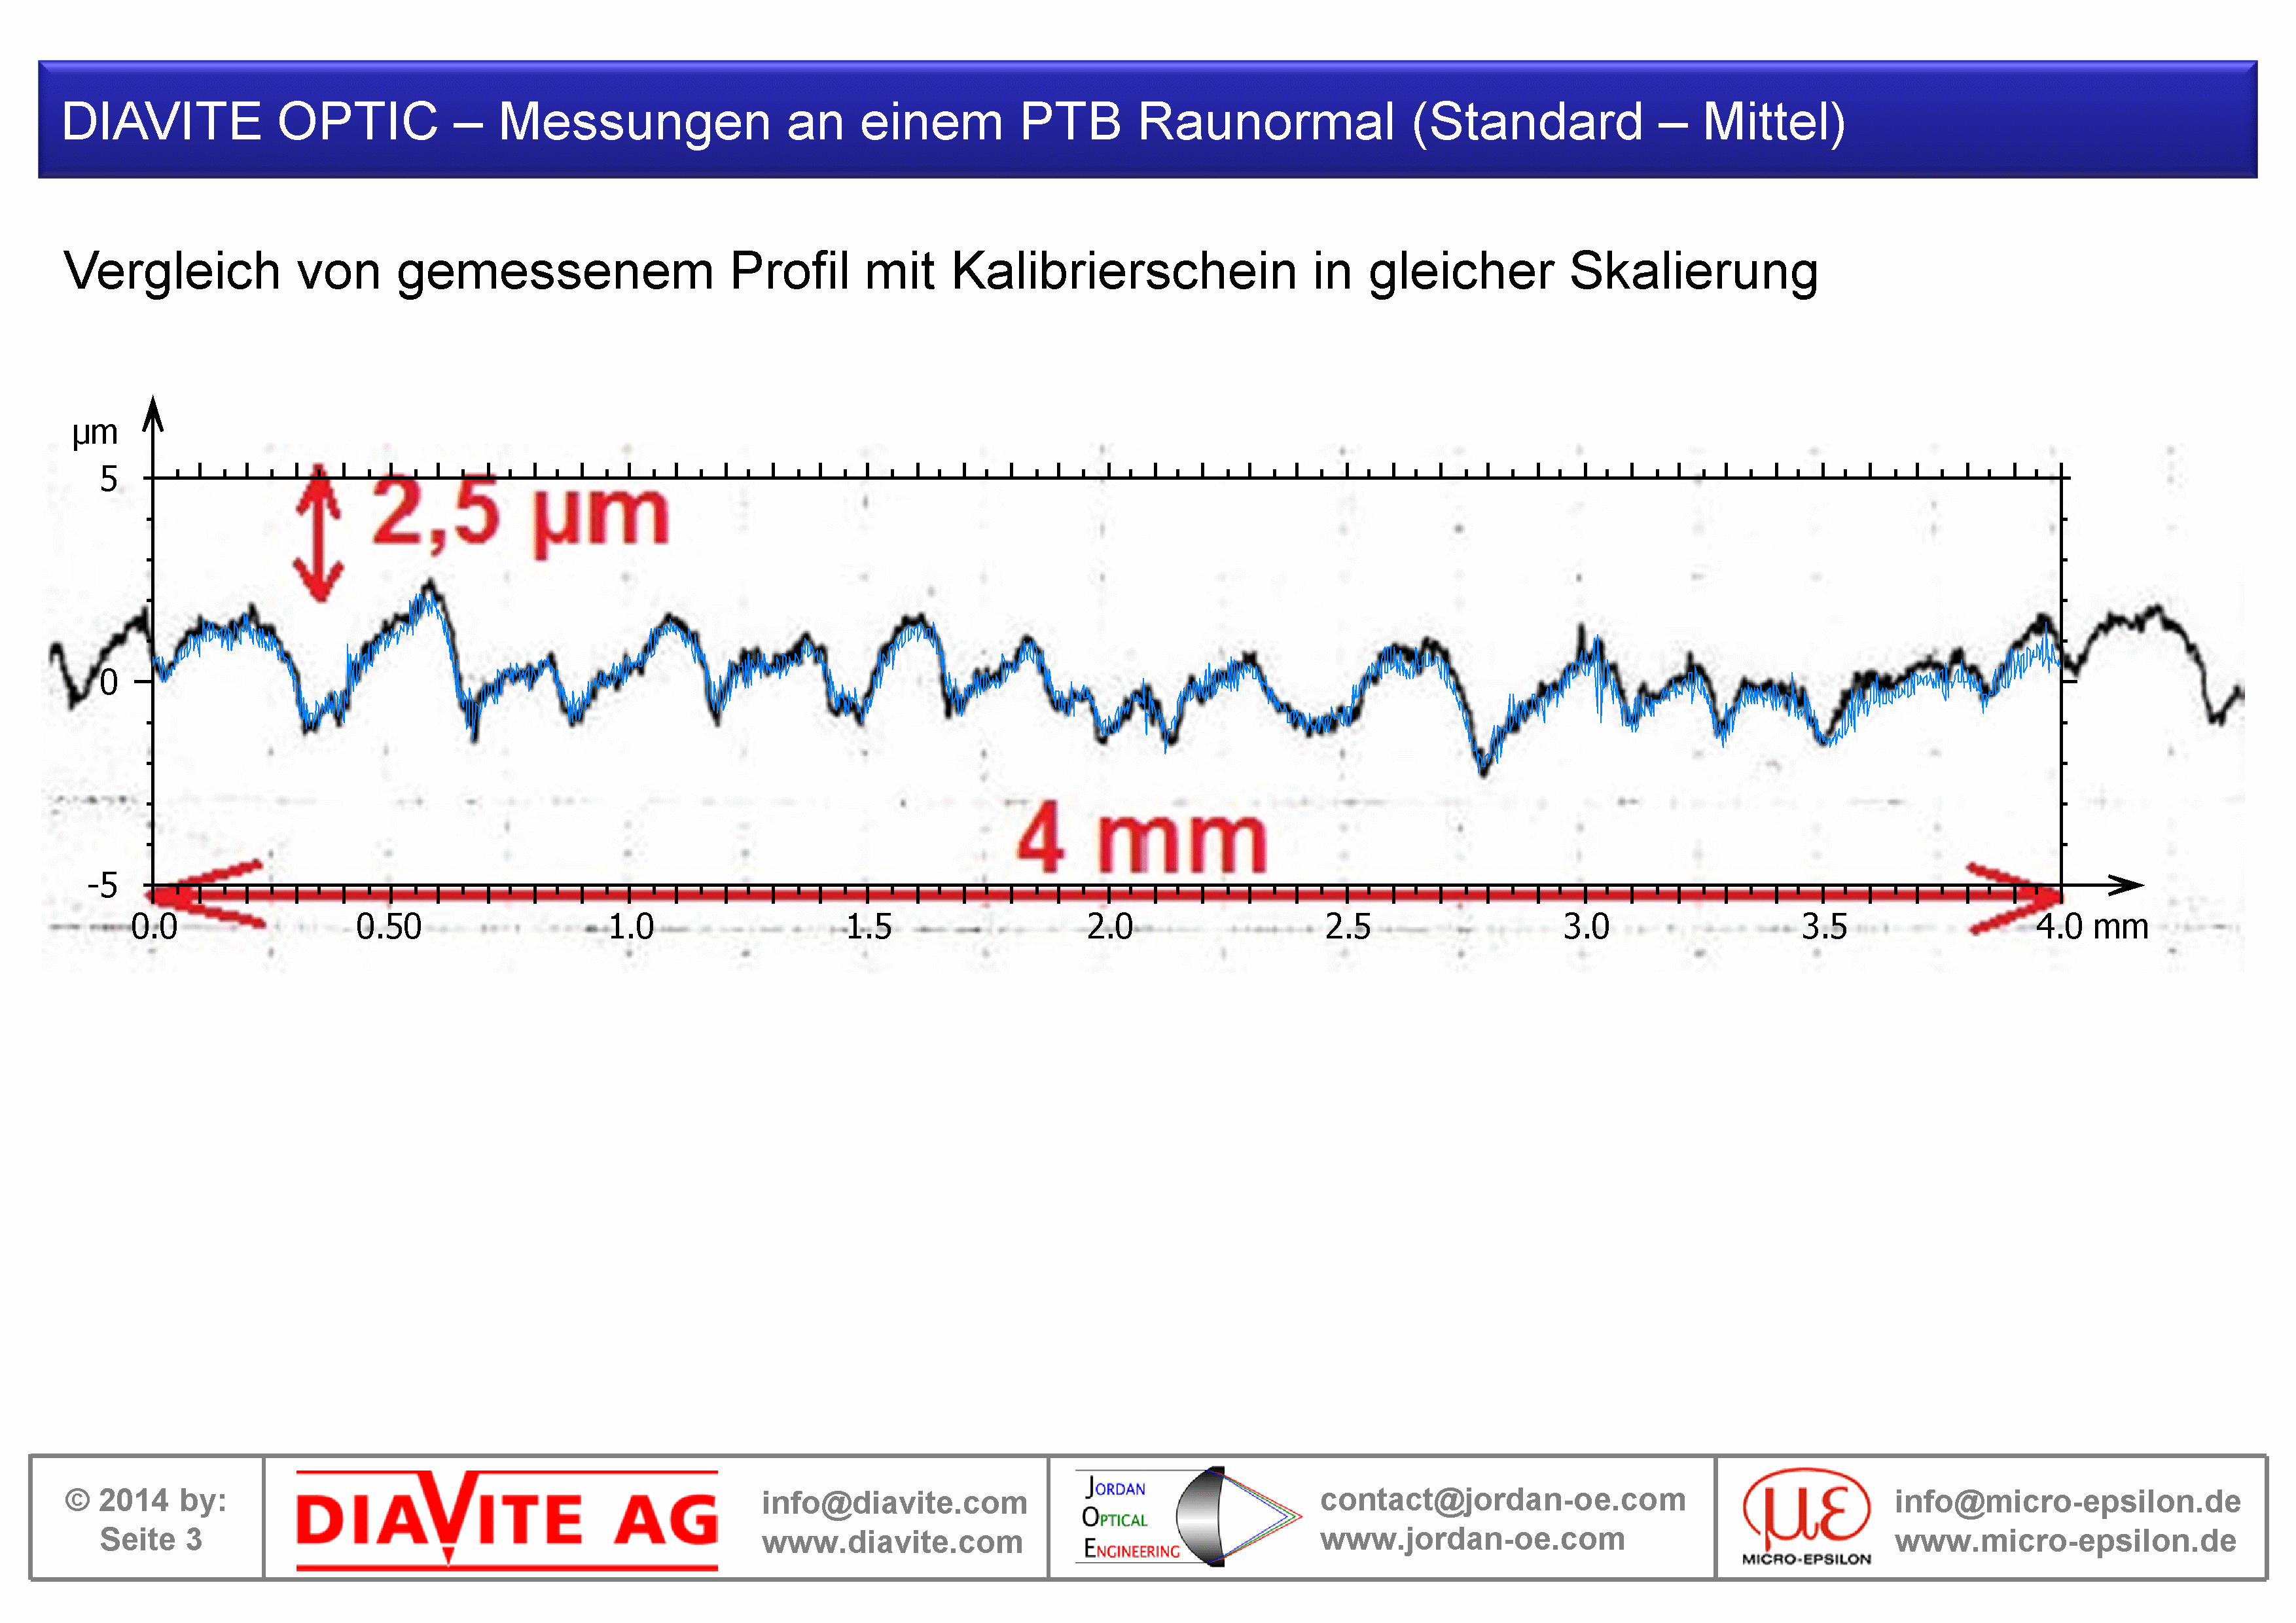
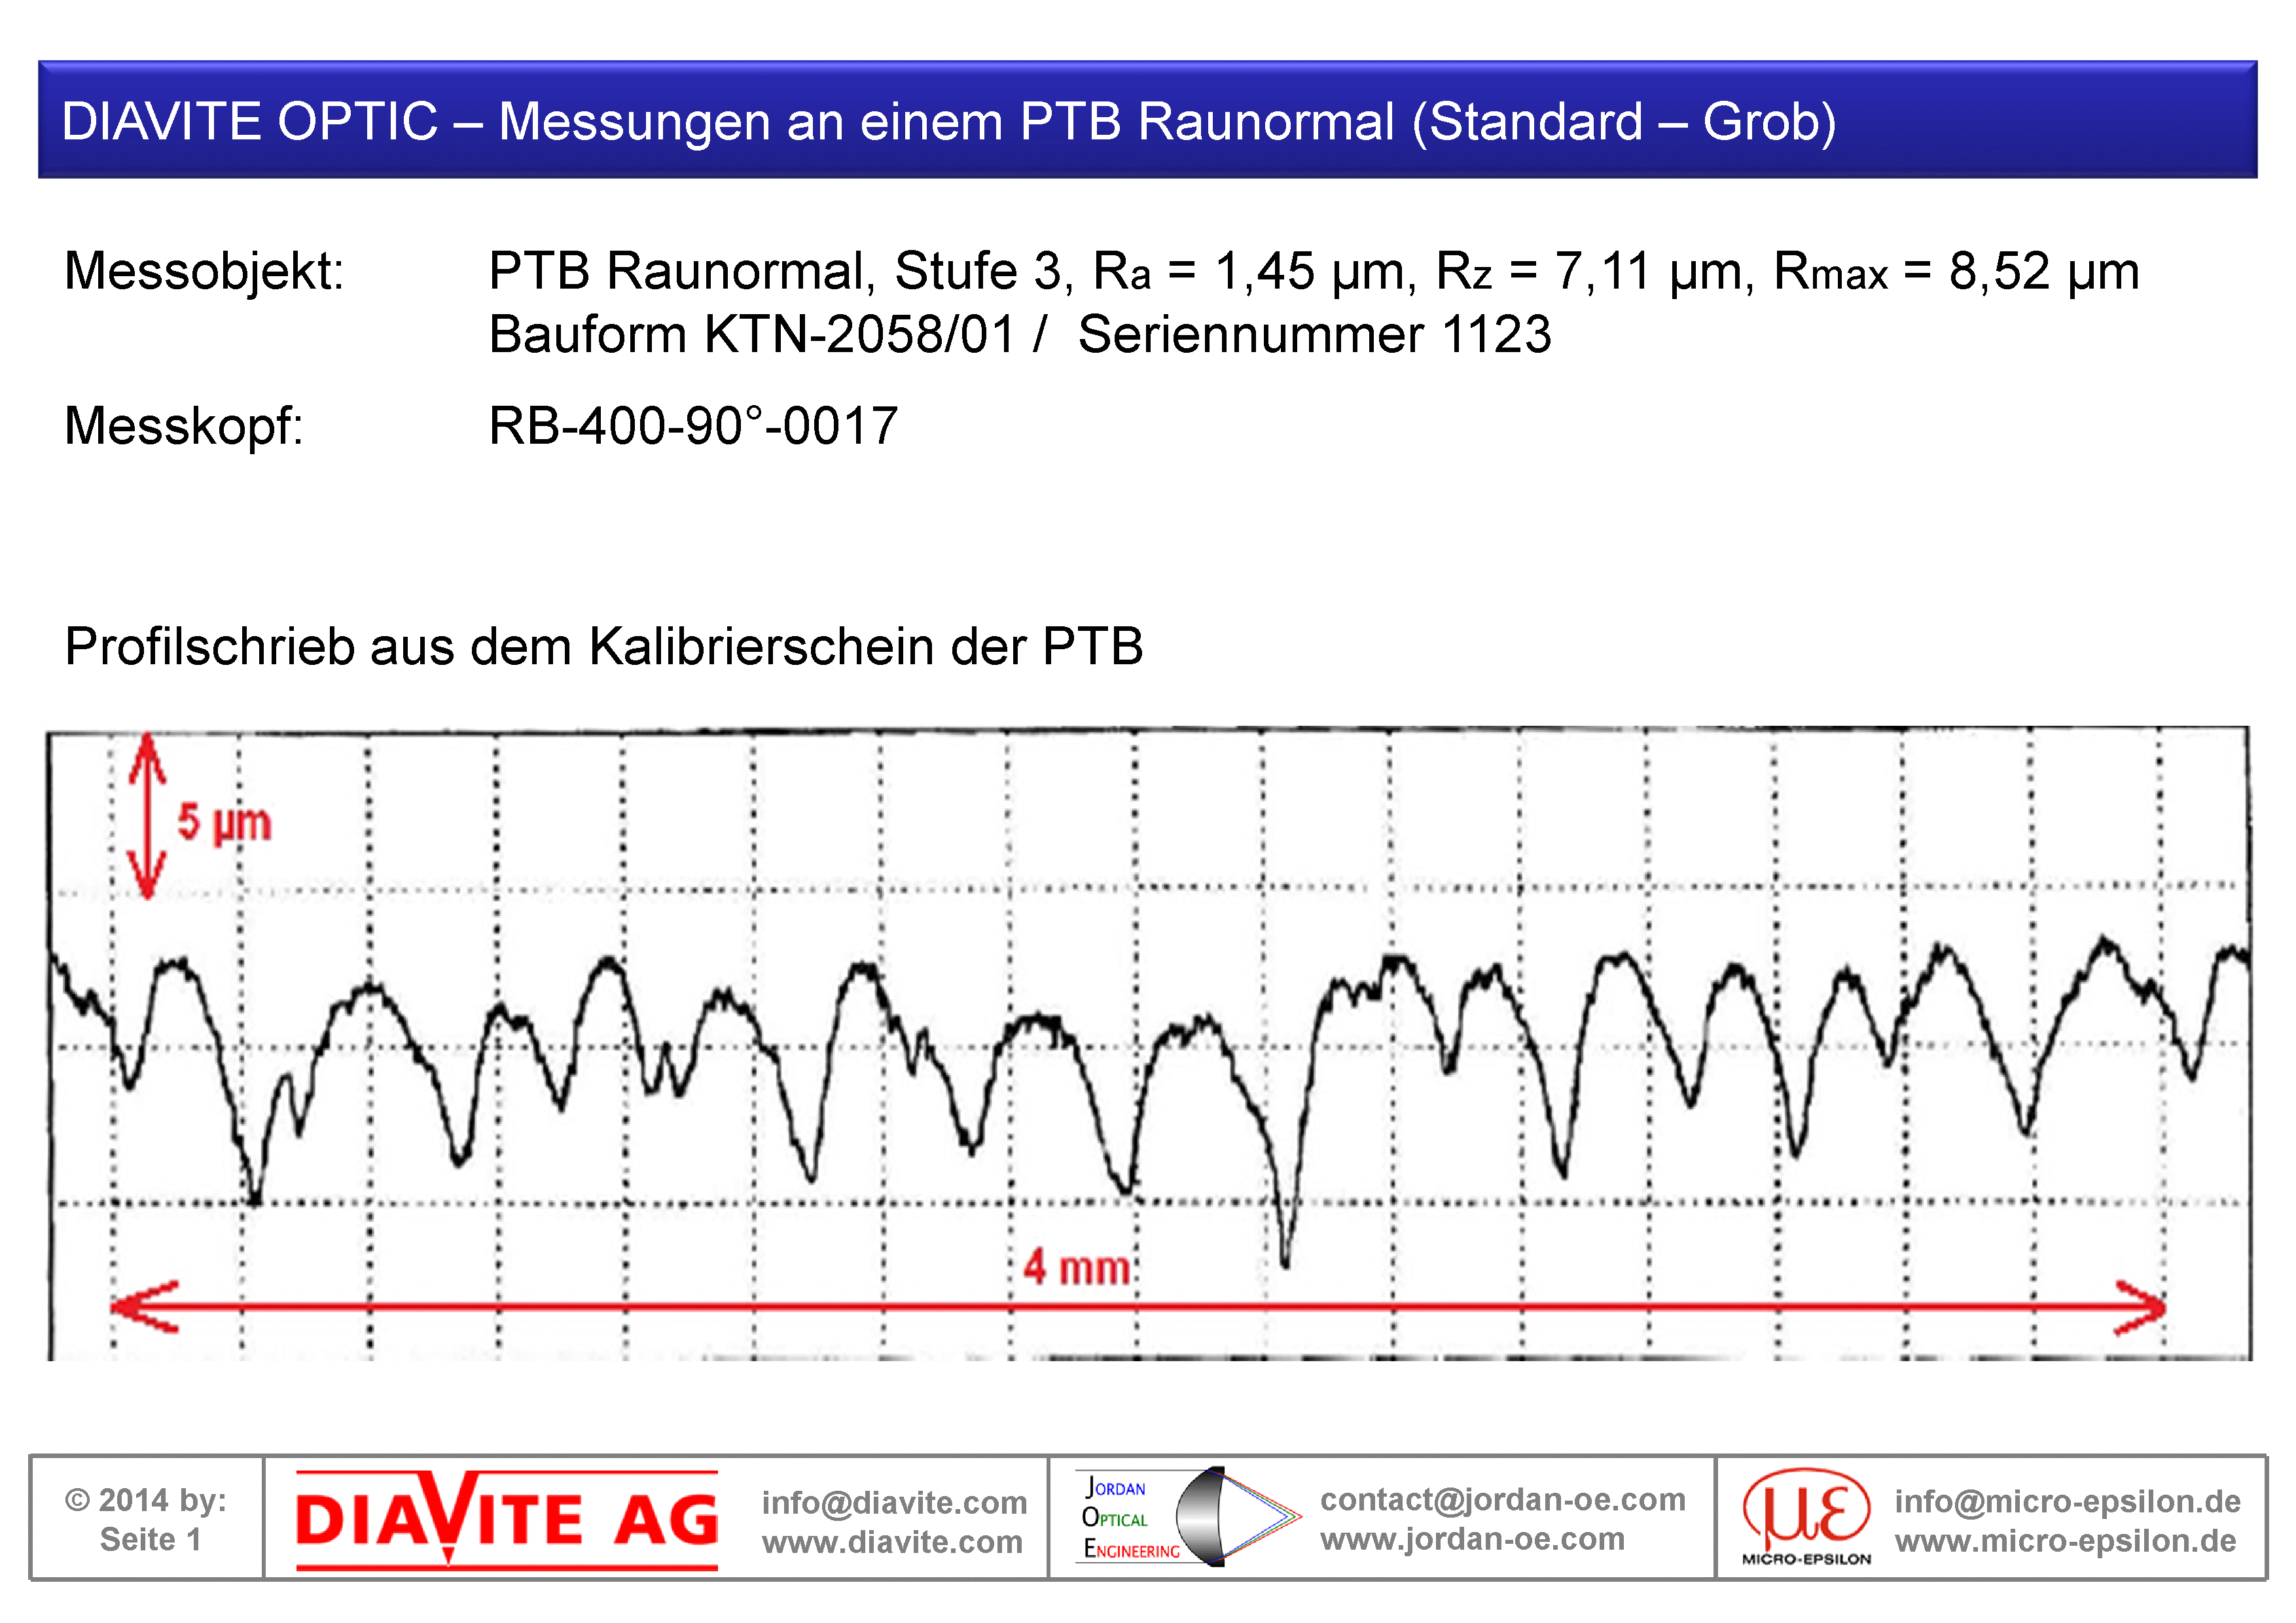
Comparison on a PTB Roughness Standard 4058/01 Level 3 (Ra = 1.45 µm). The left image shows the tactile reference measurement. The middle image shows the optical comparison measurement and the right image the superposition of both profiles.


PTB-RN-4070/03 Stage 1
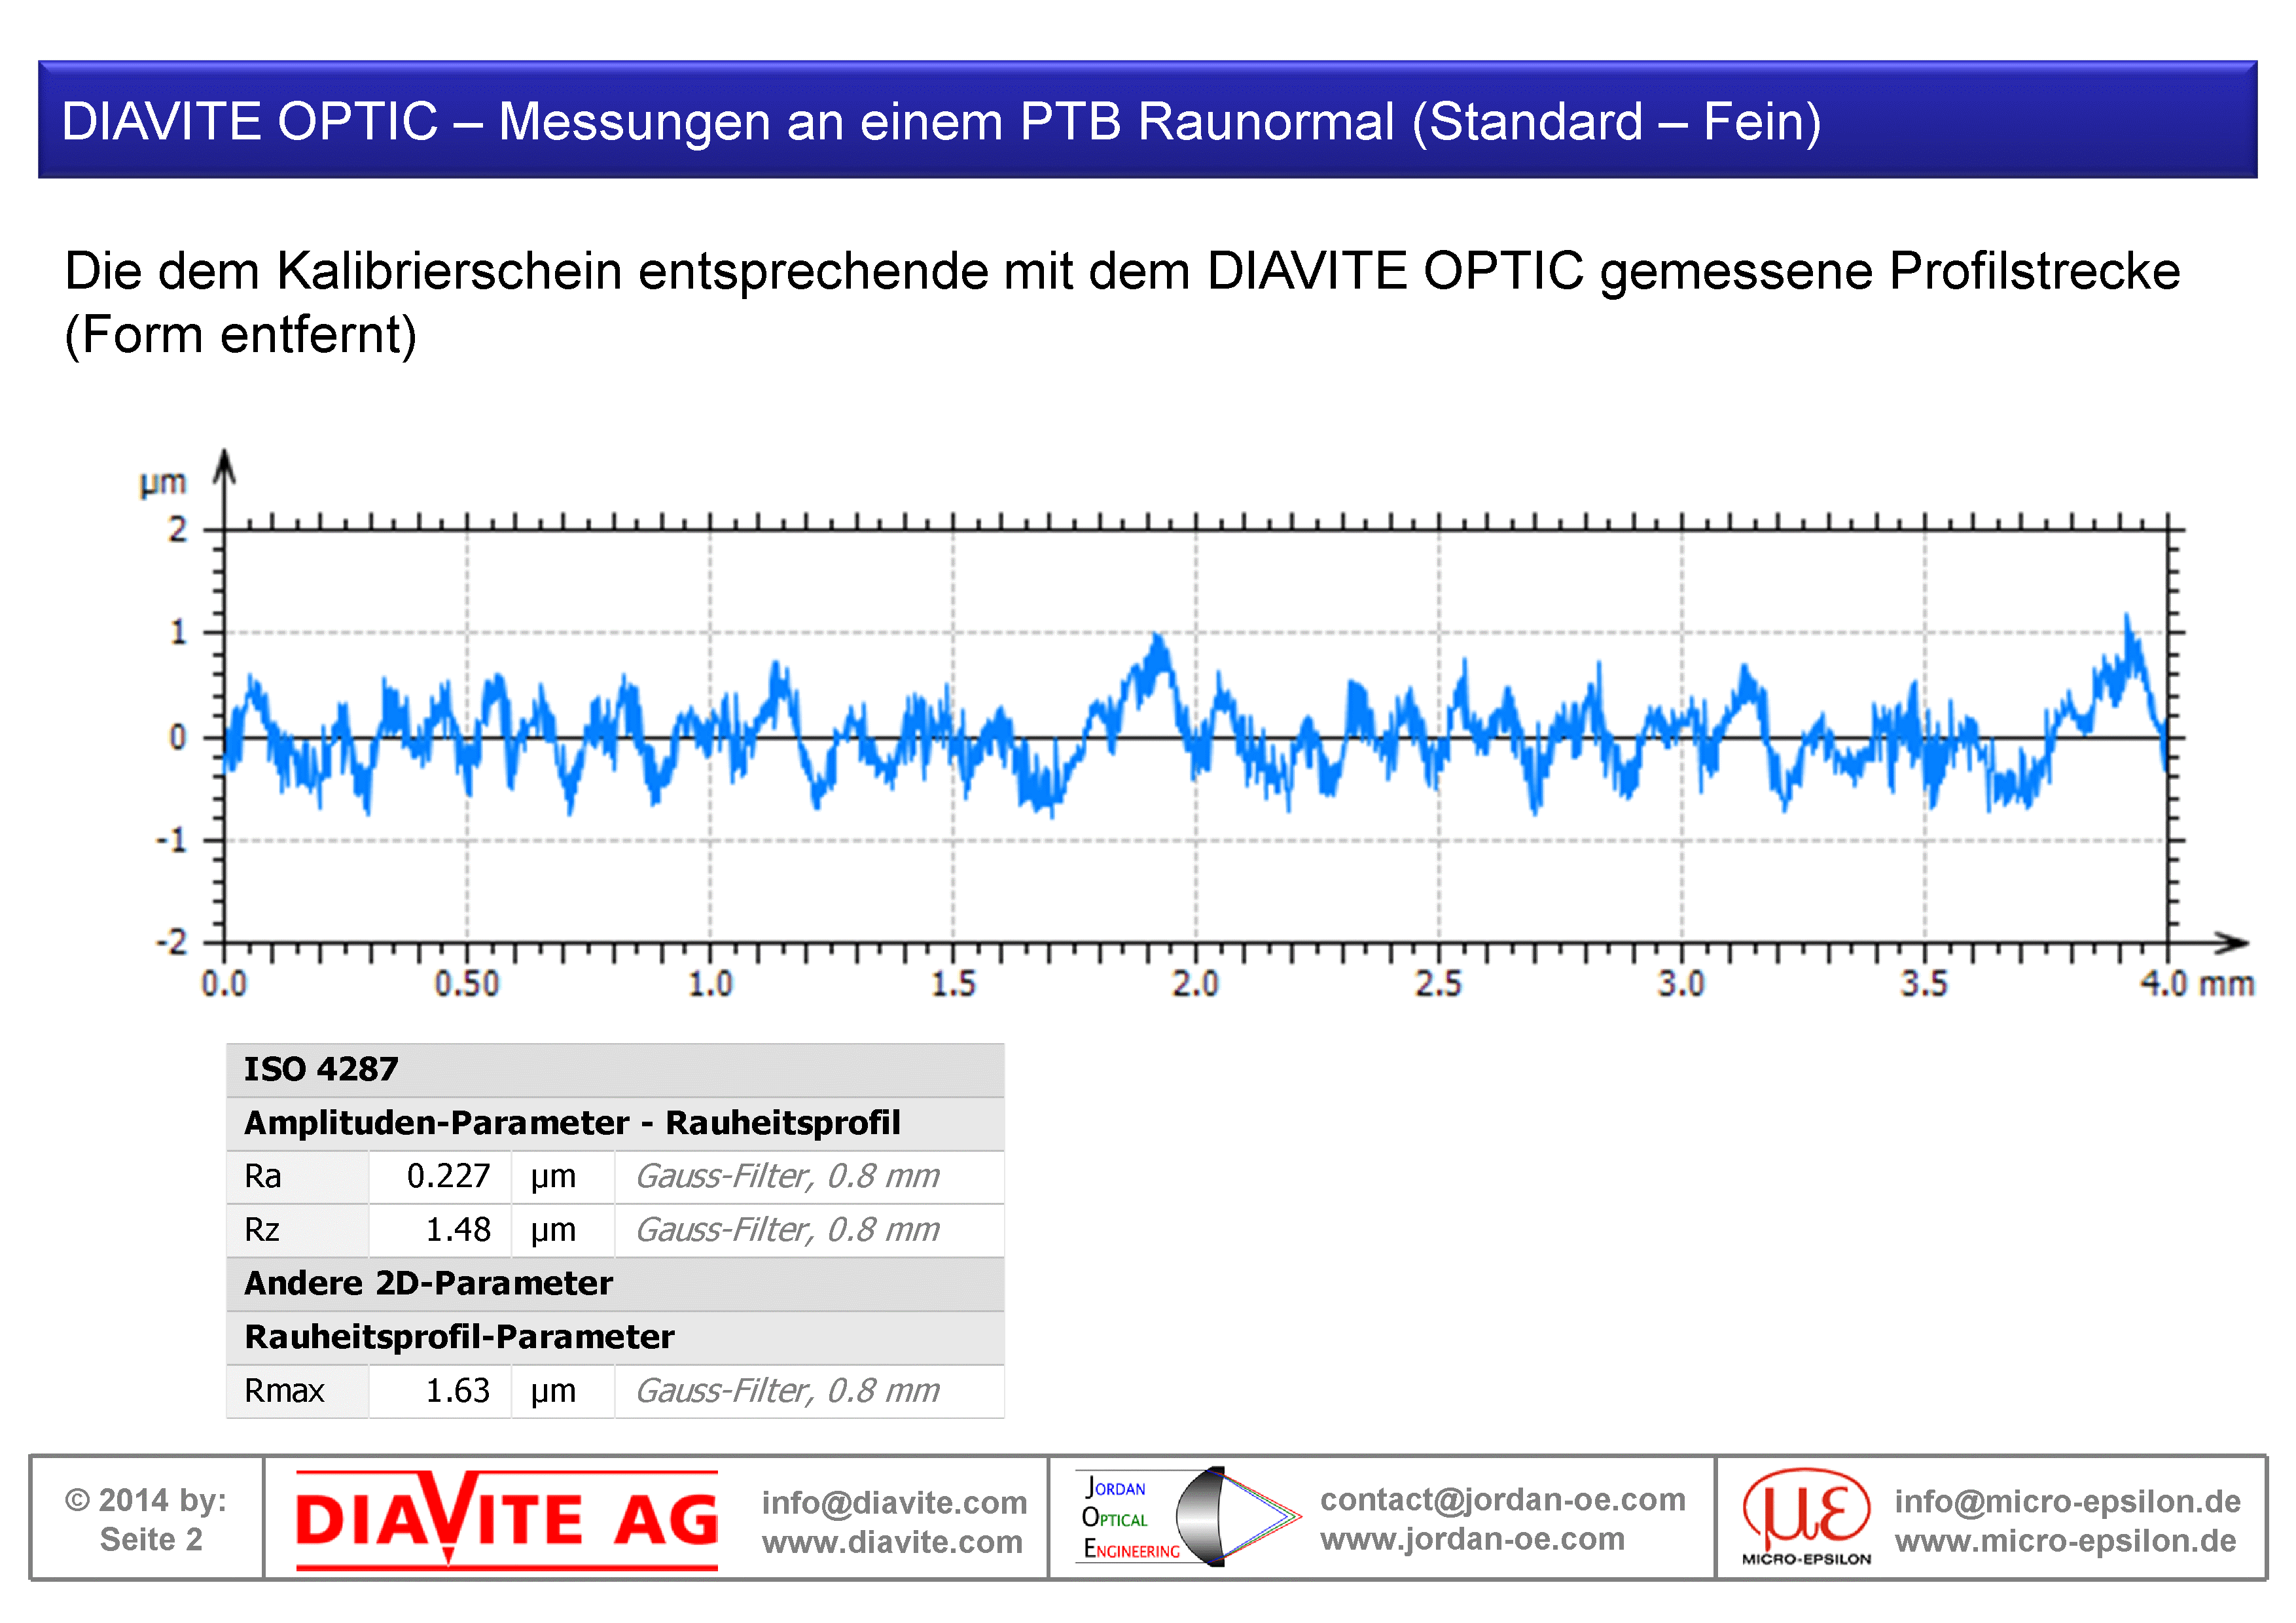
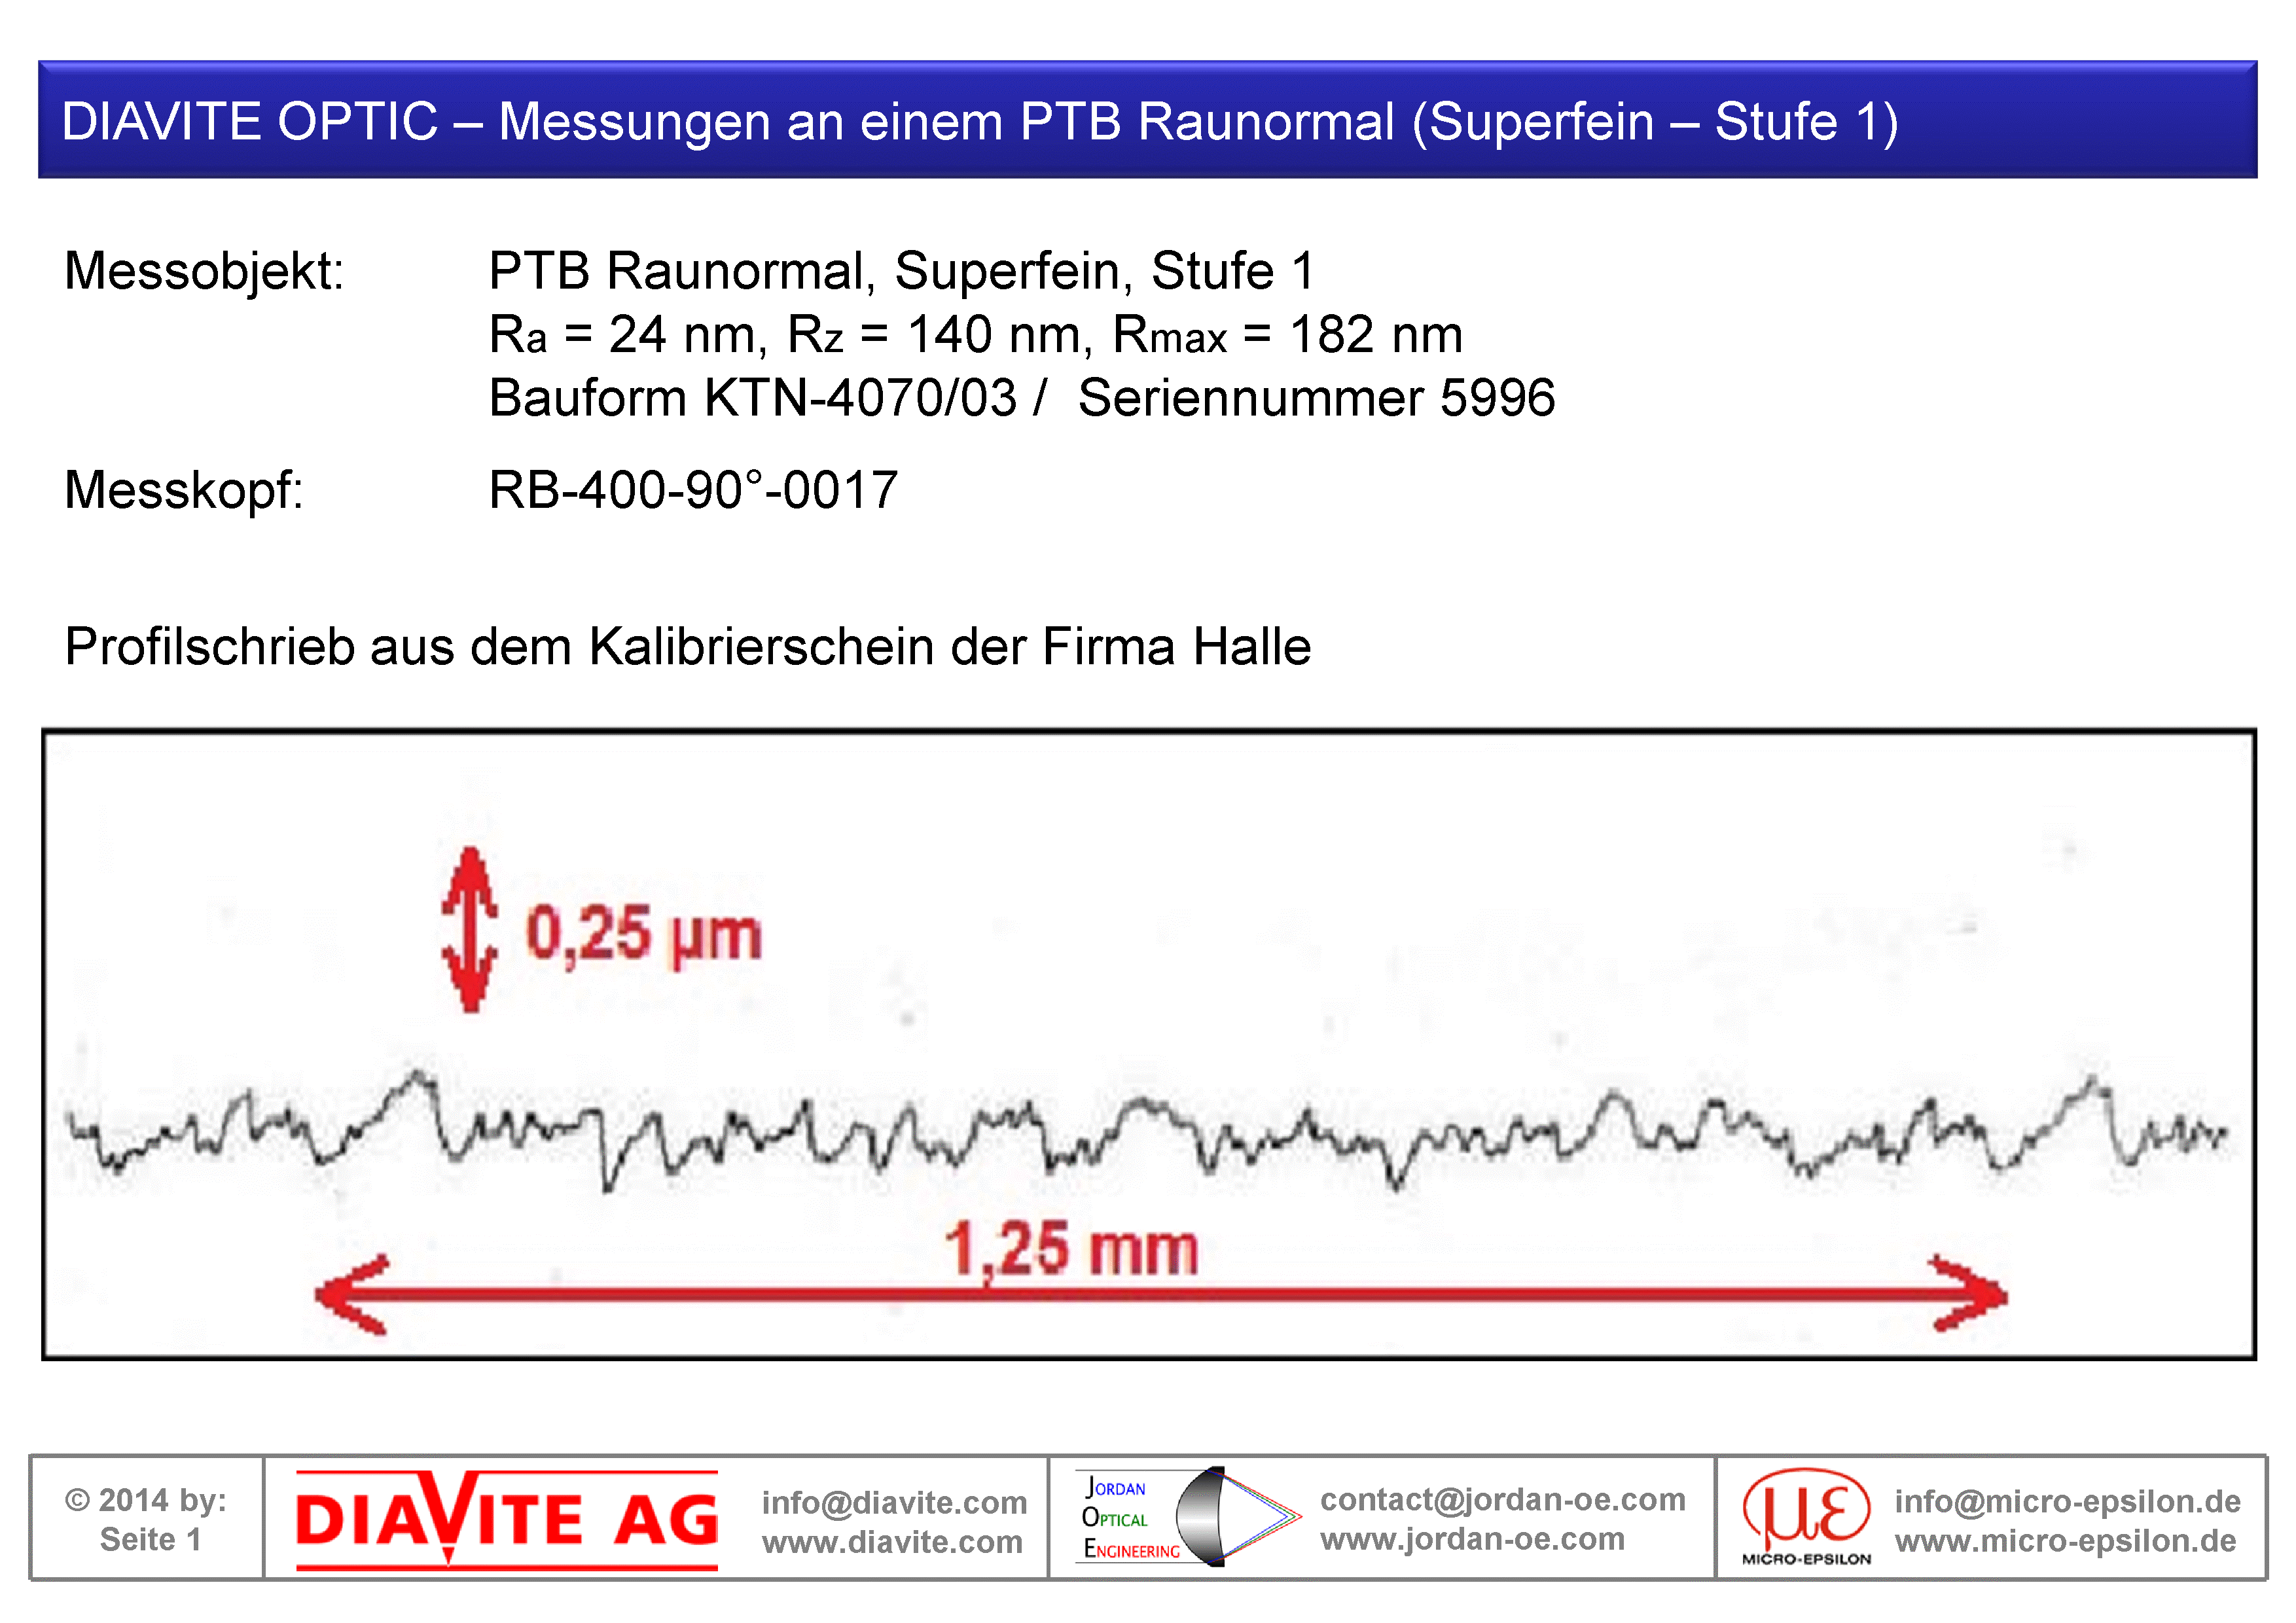
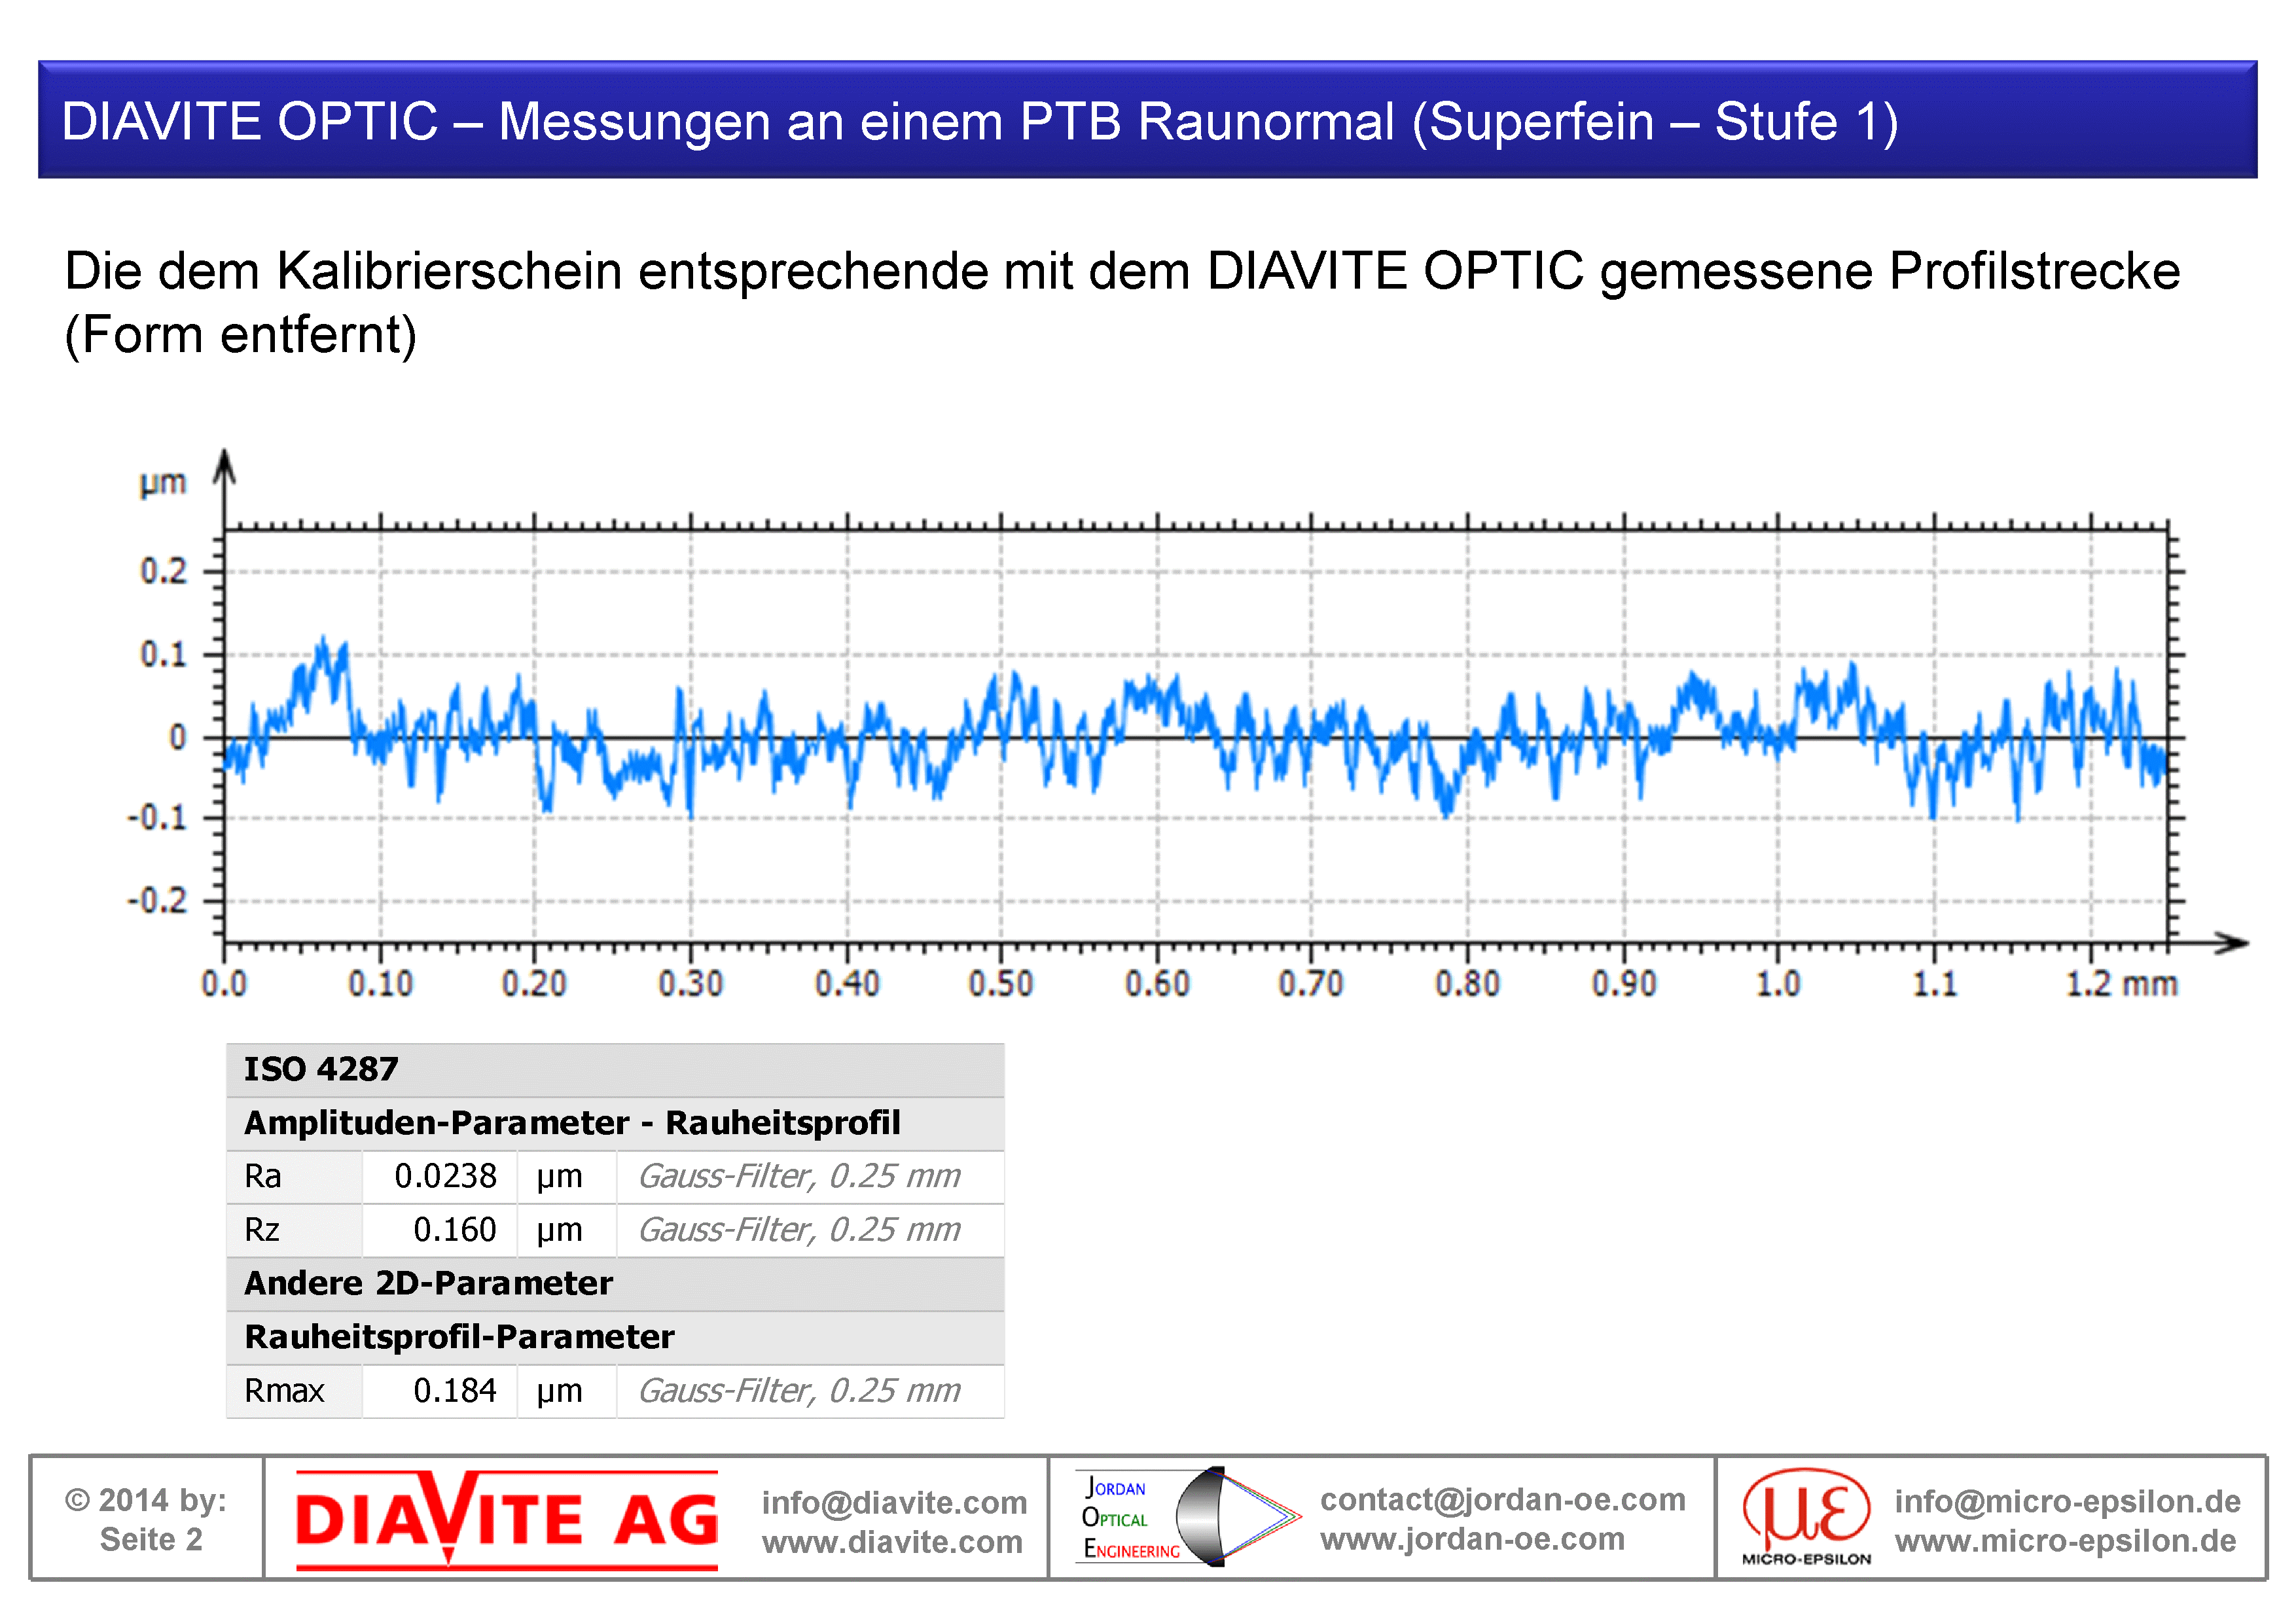
Comparison on a superfine PTB Roughness Standard 4070/03 level 1 (Ra = 24 nm). The left image shows the tactile reference measurement. The middle image shows the optical comparison measurement and the right image the superposition of both profiles.
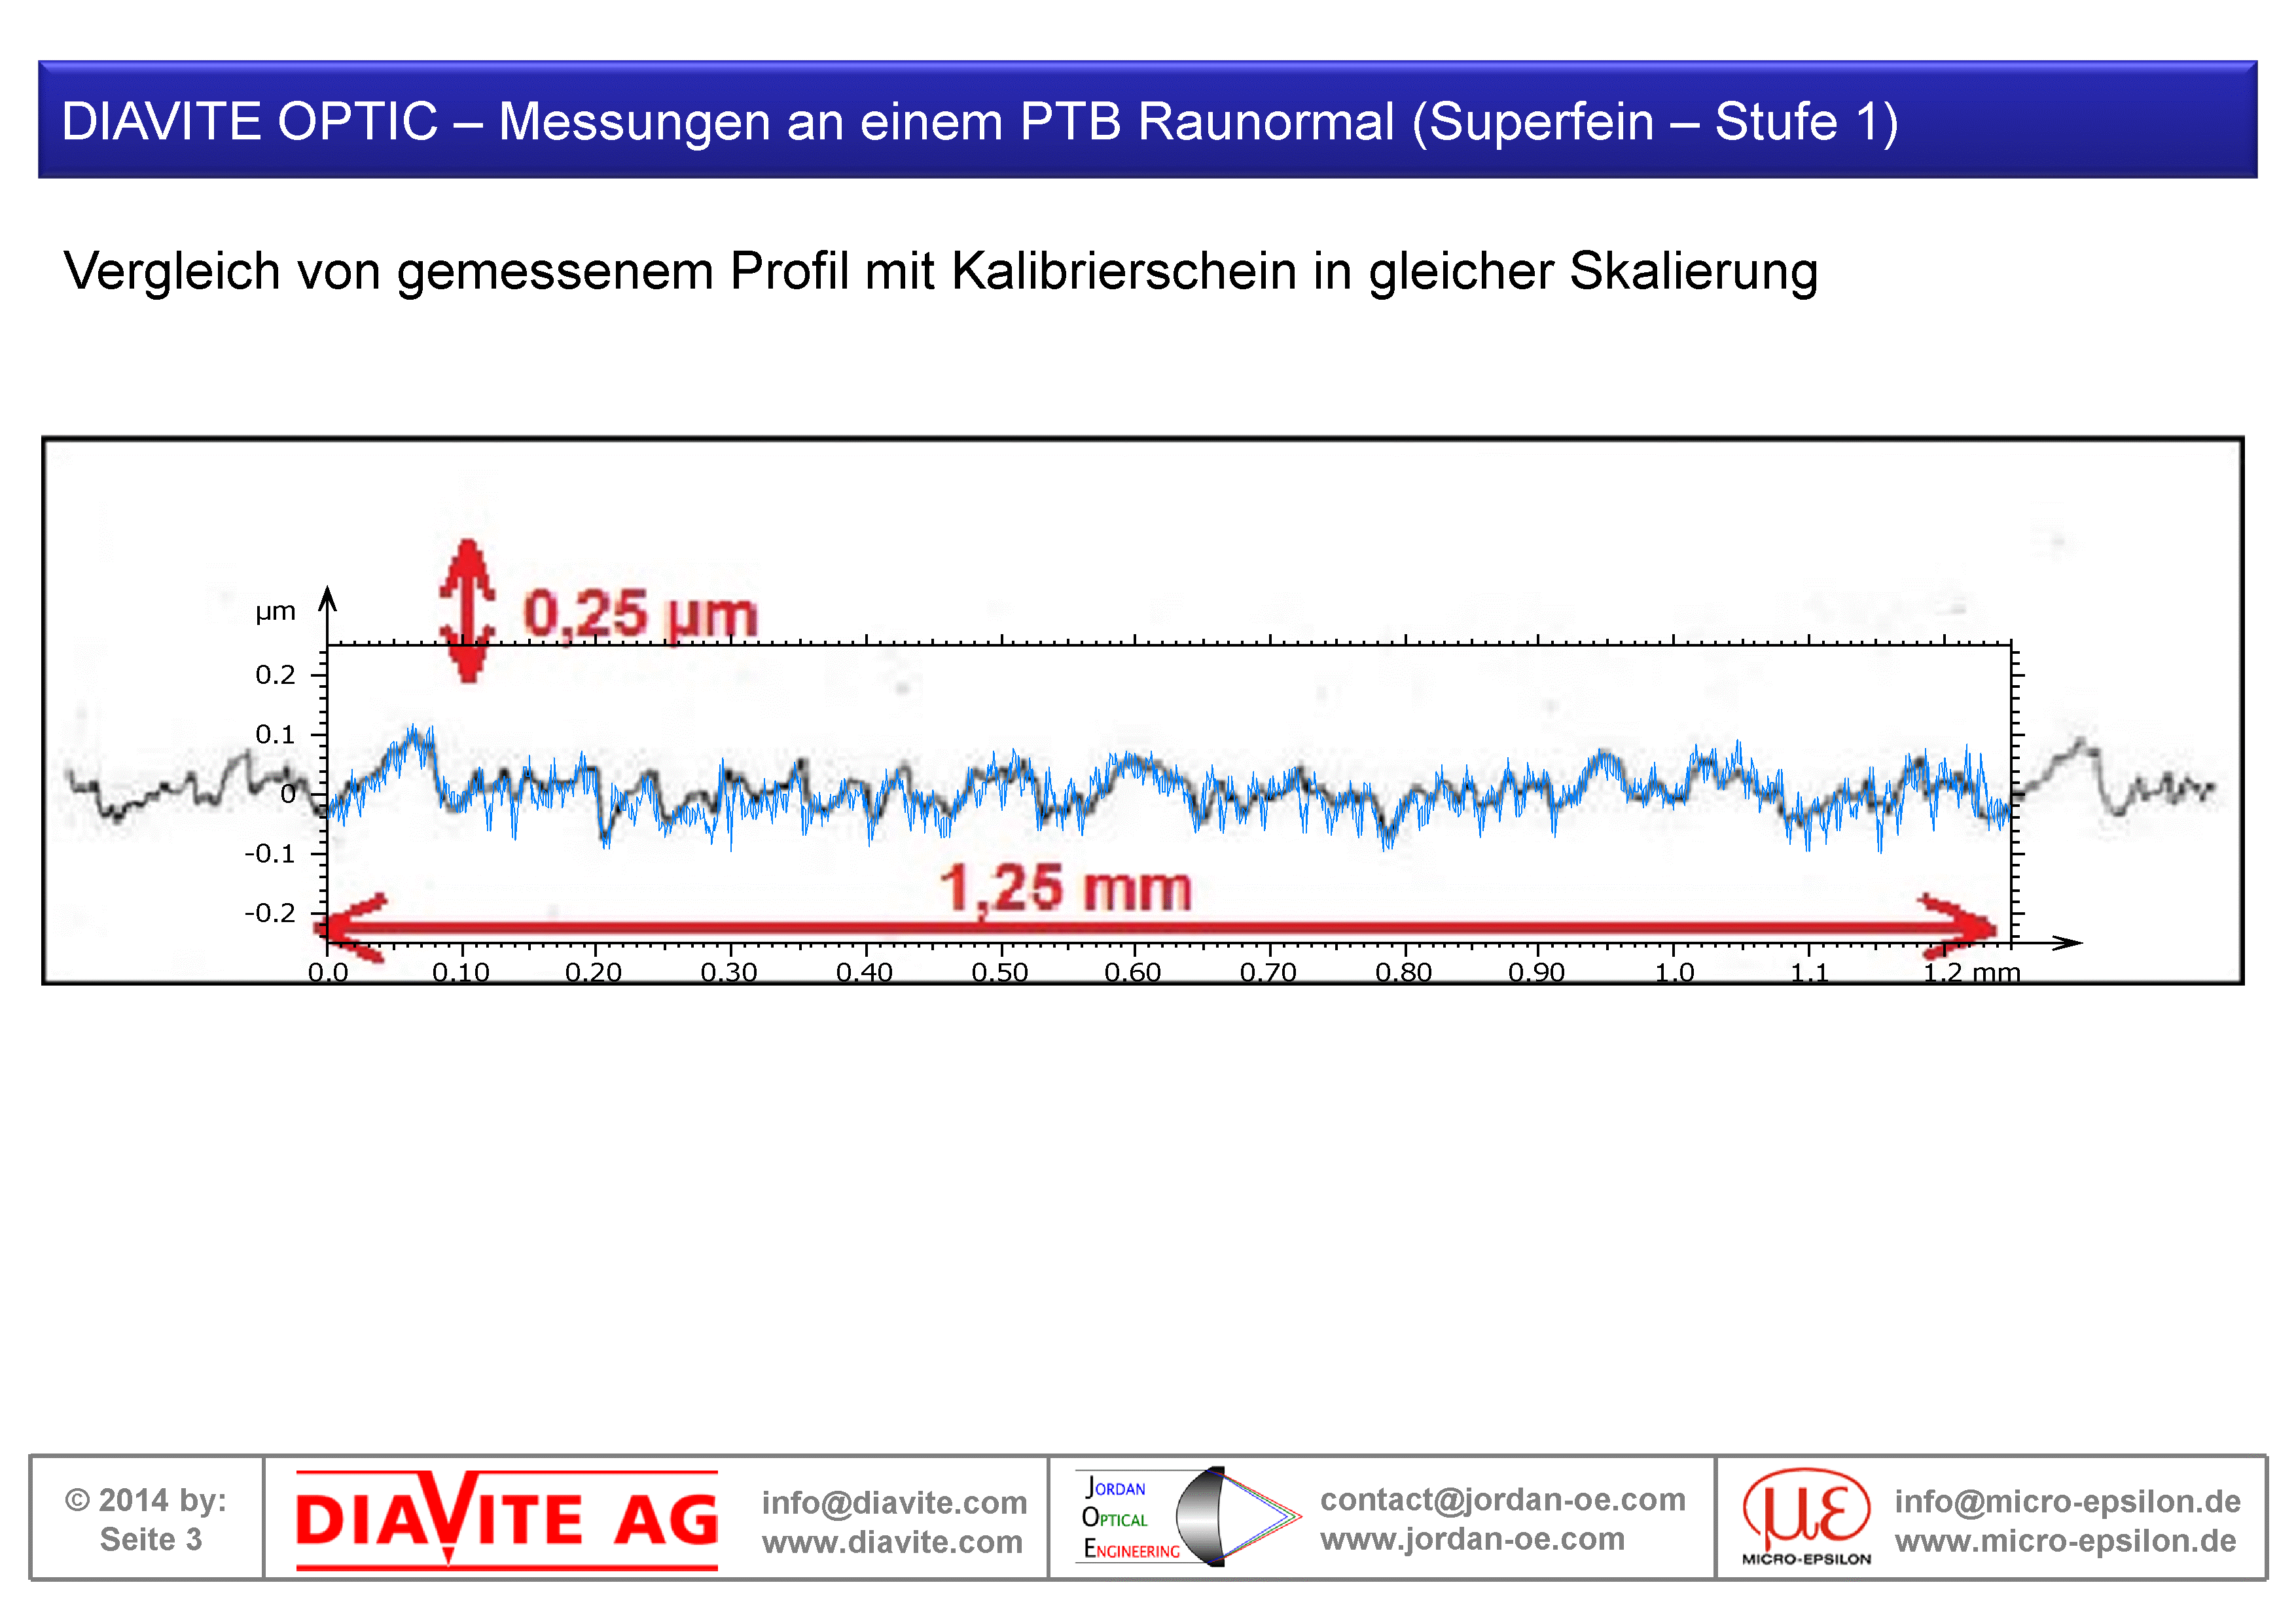
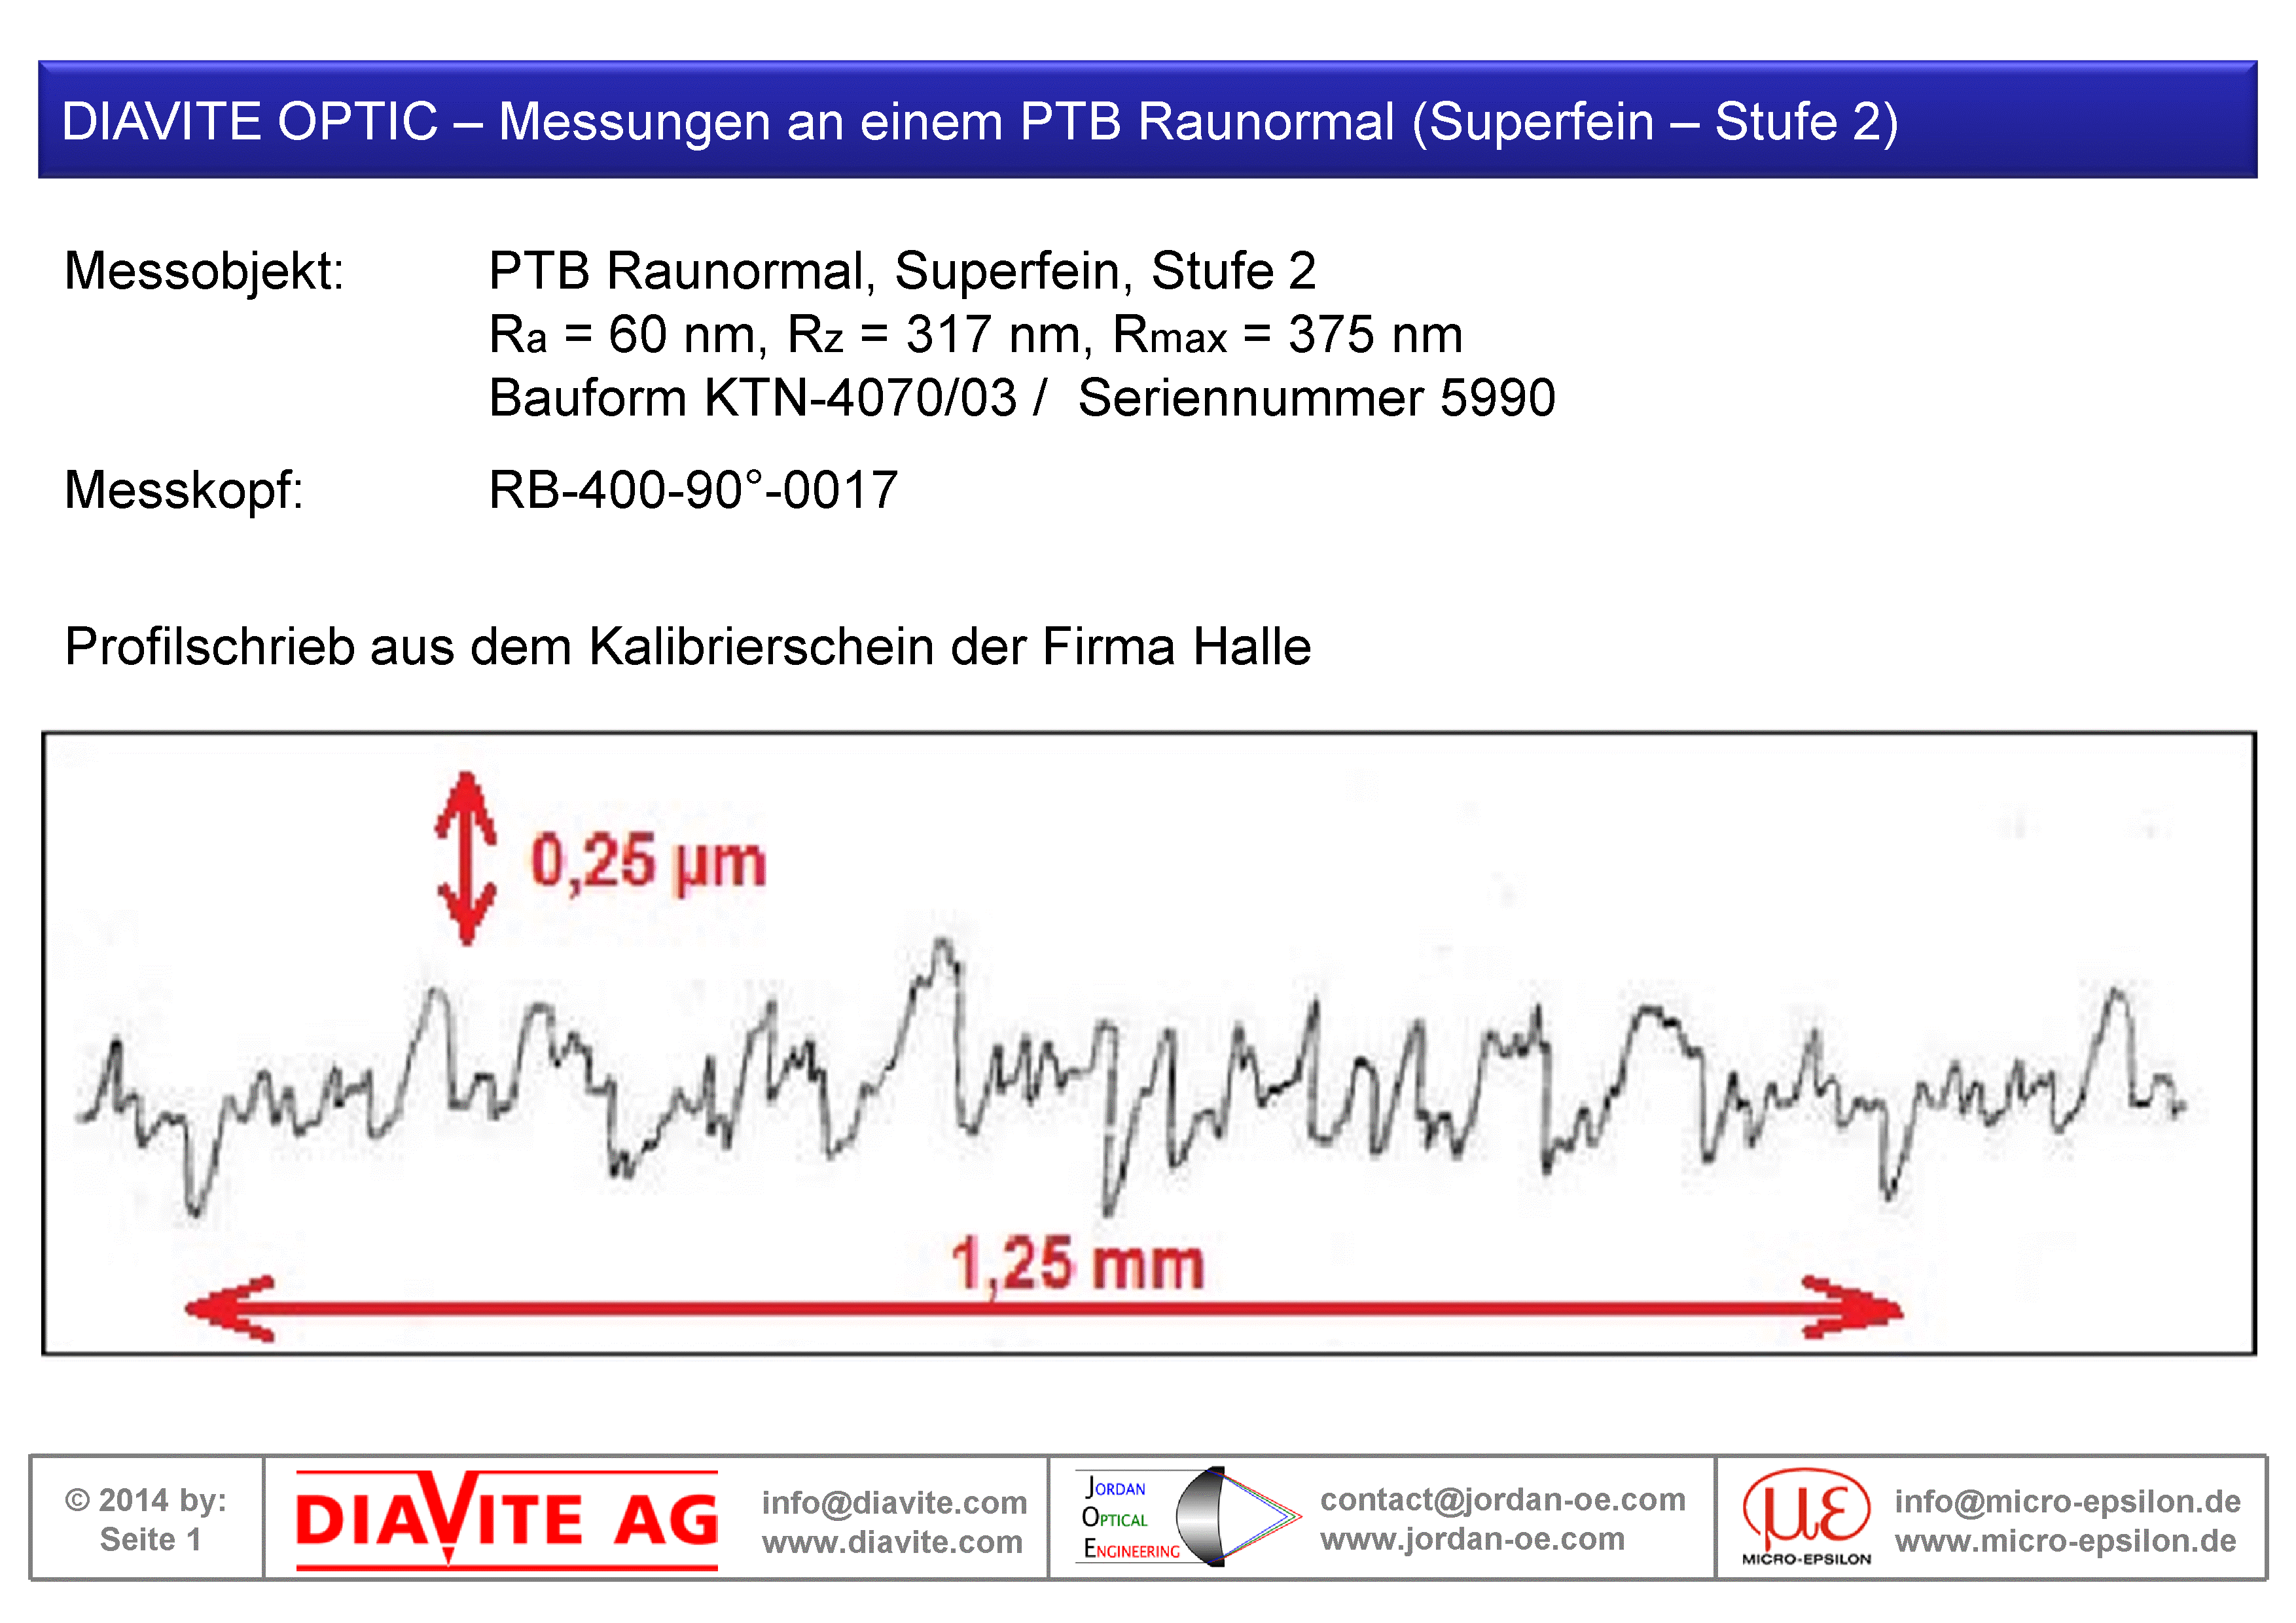
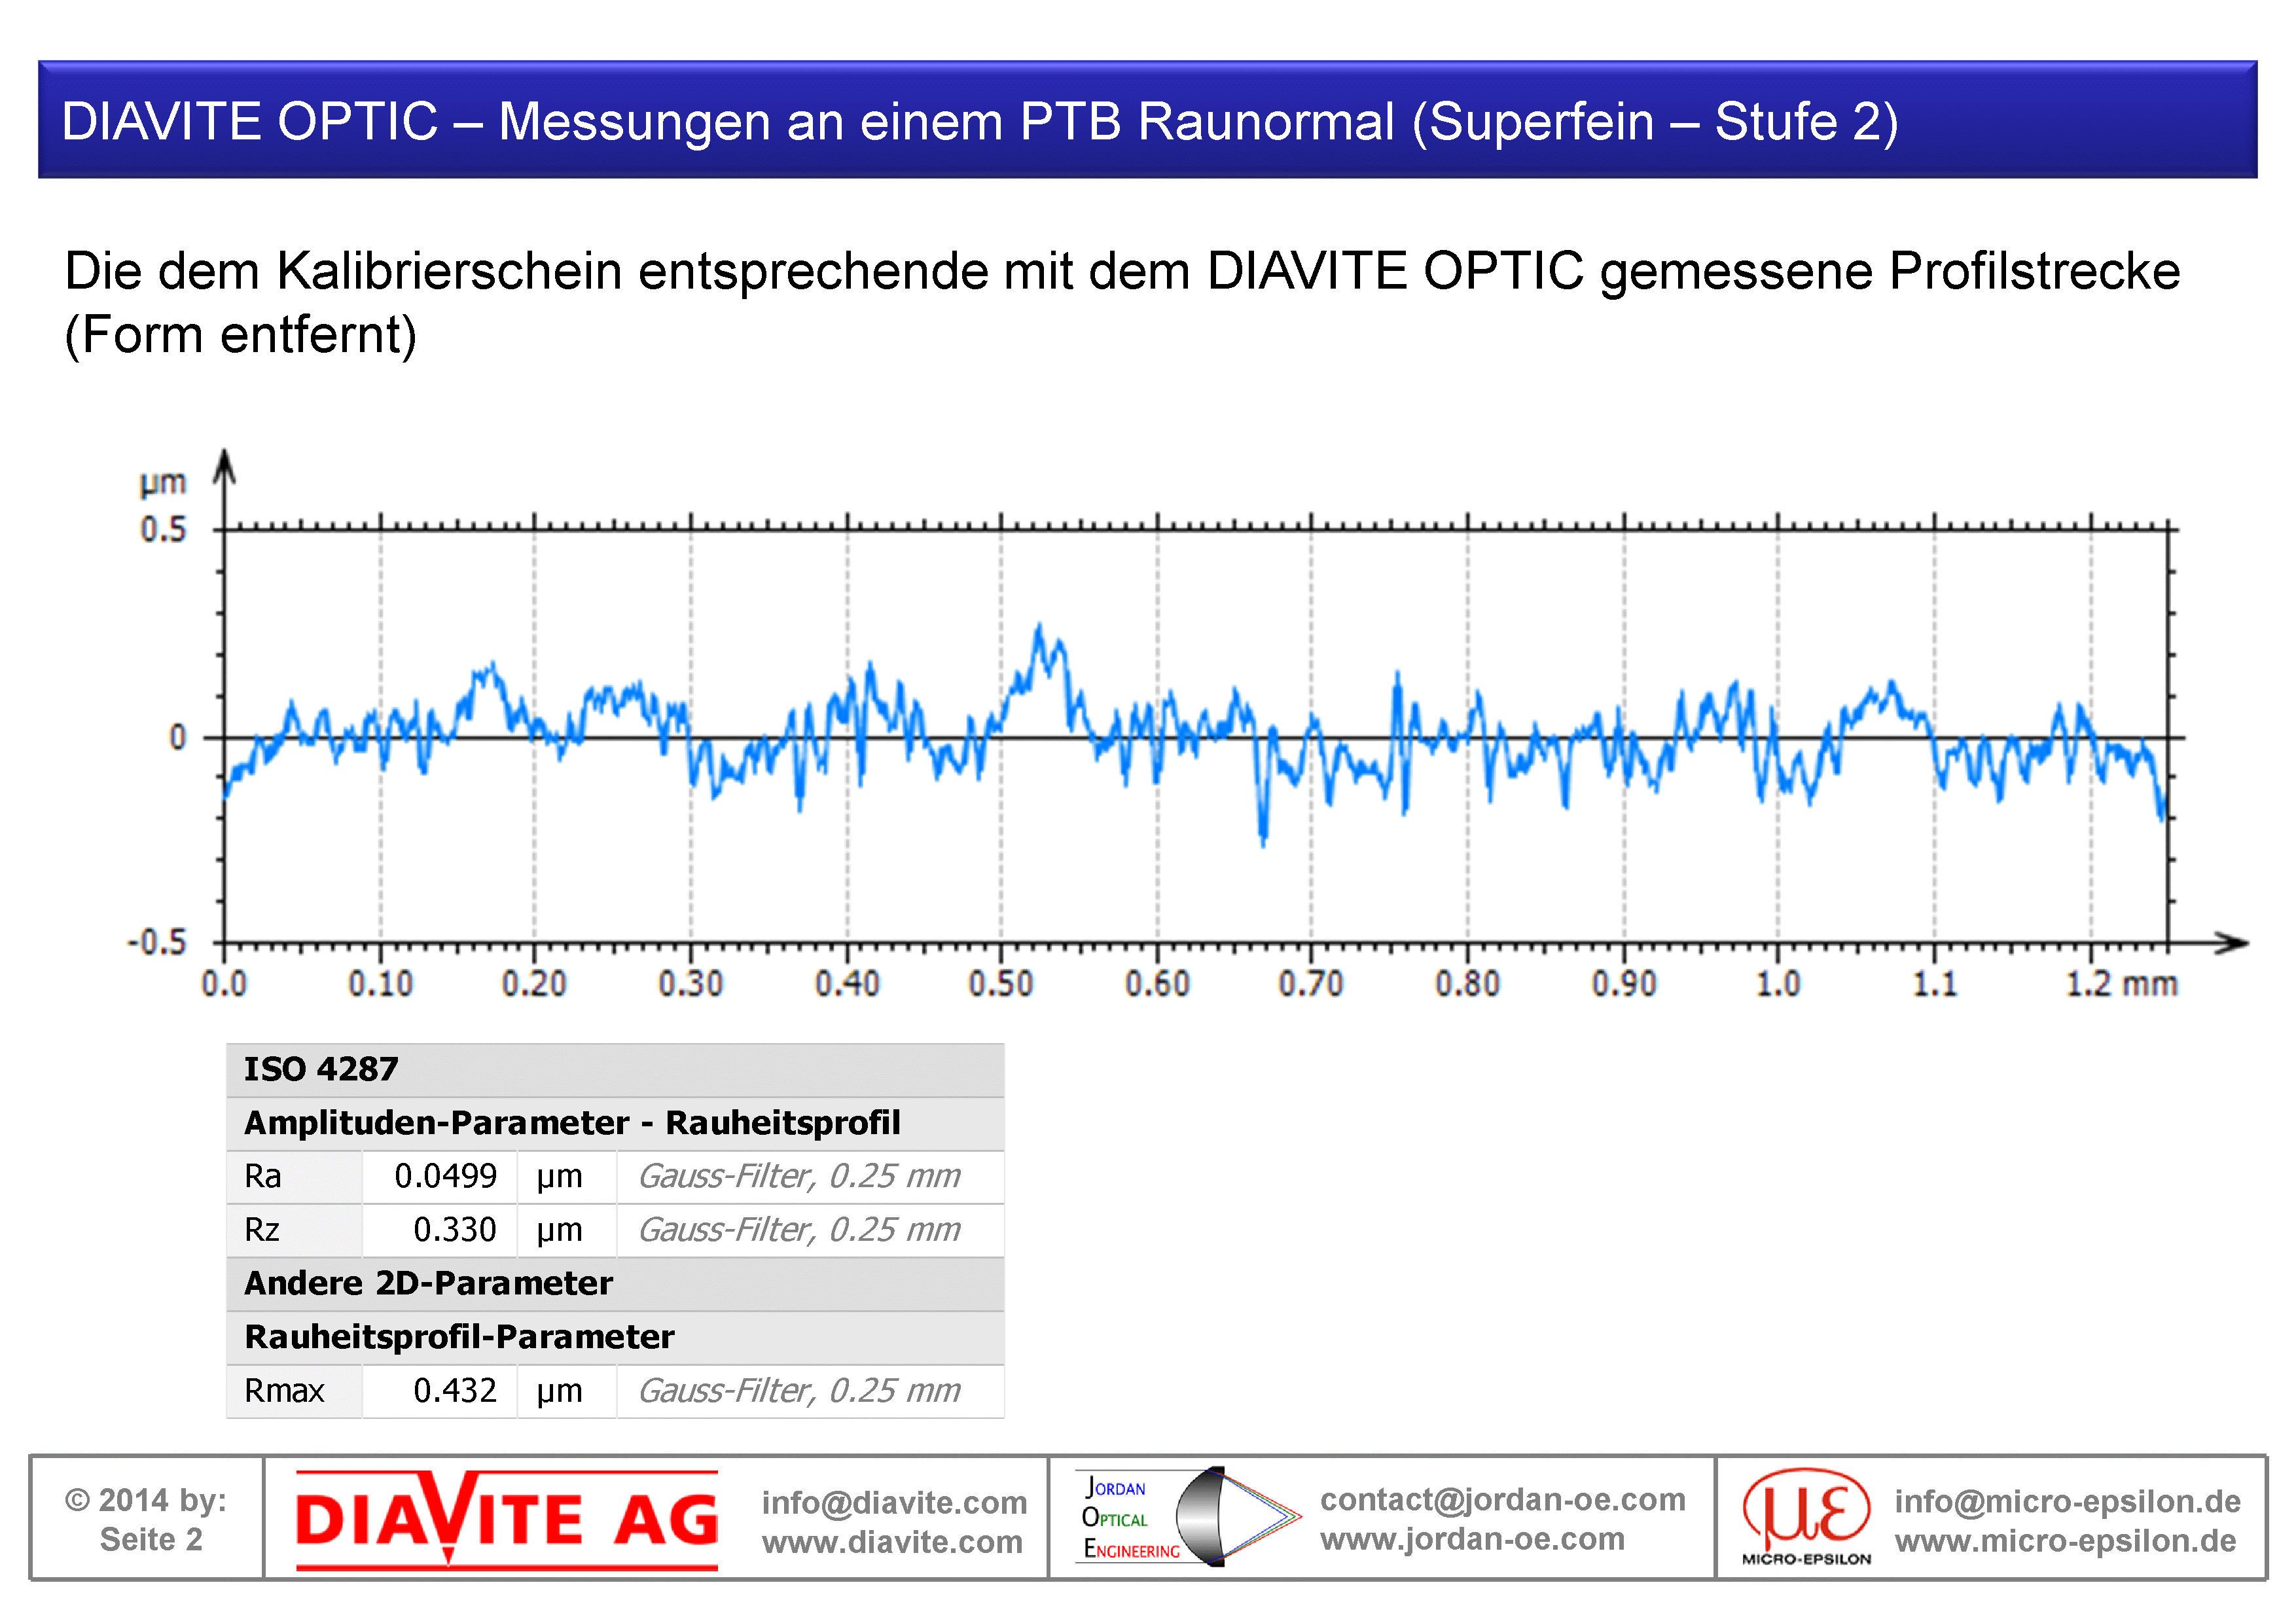
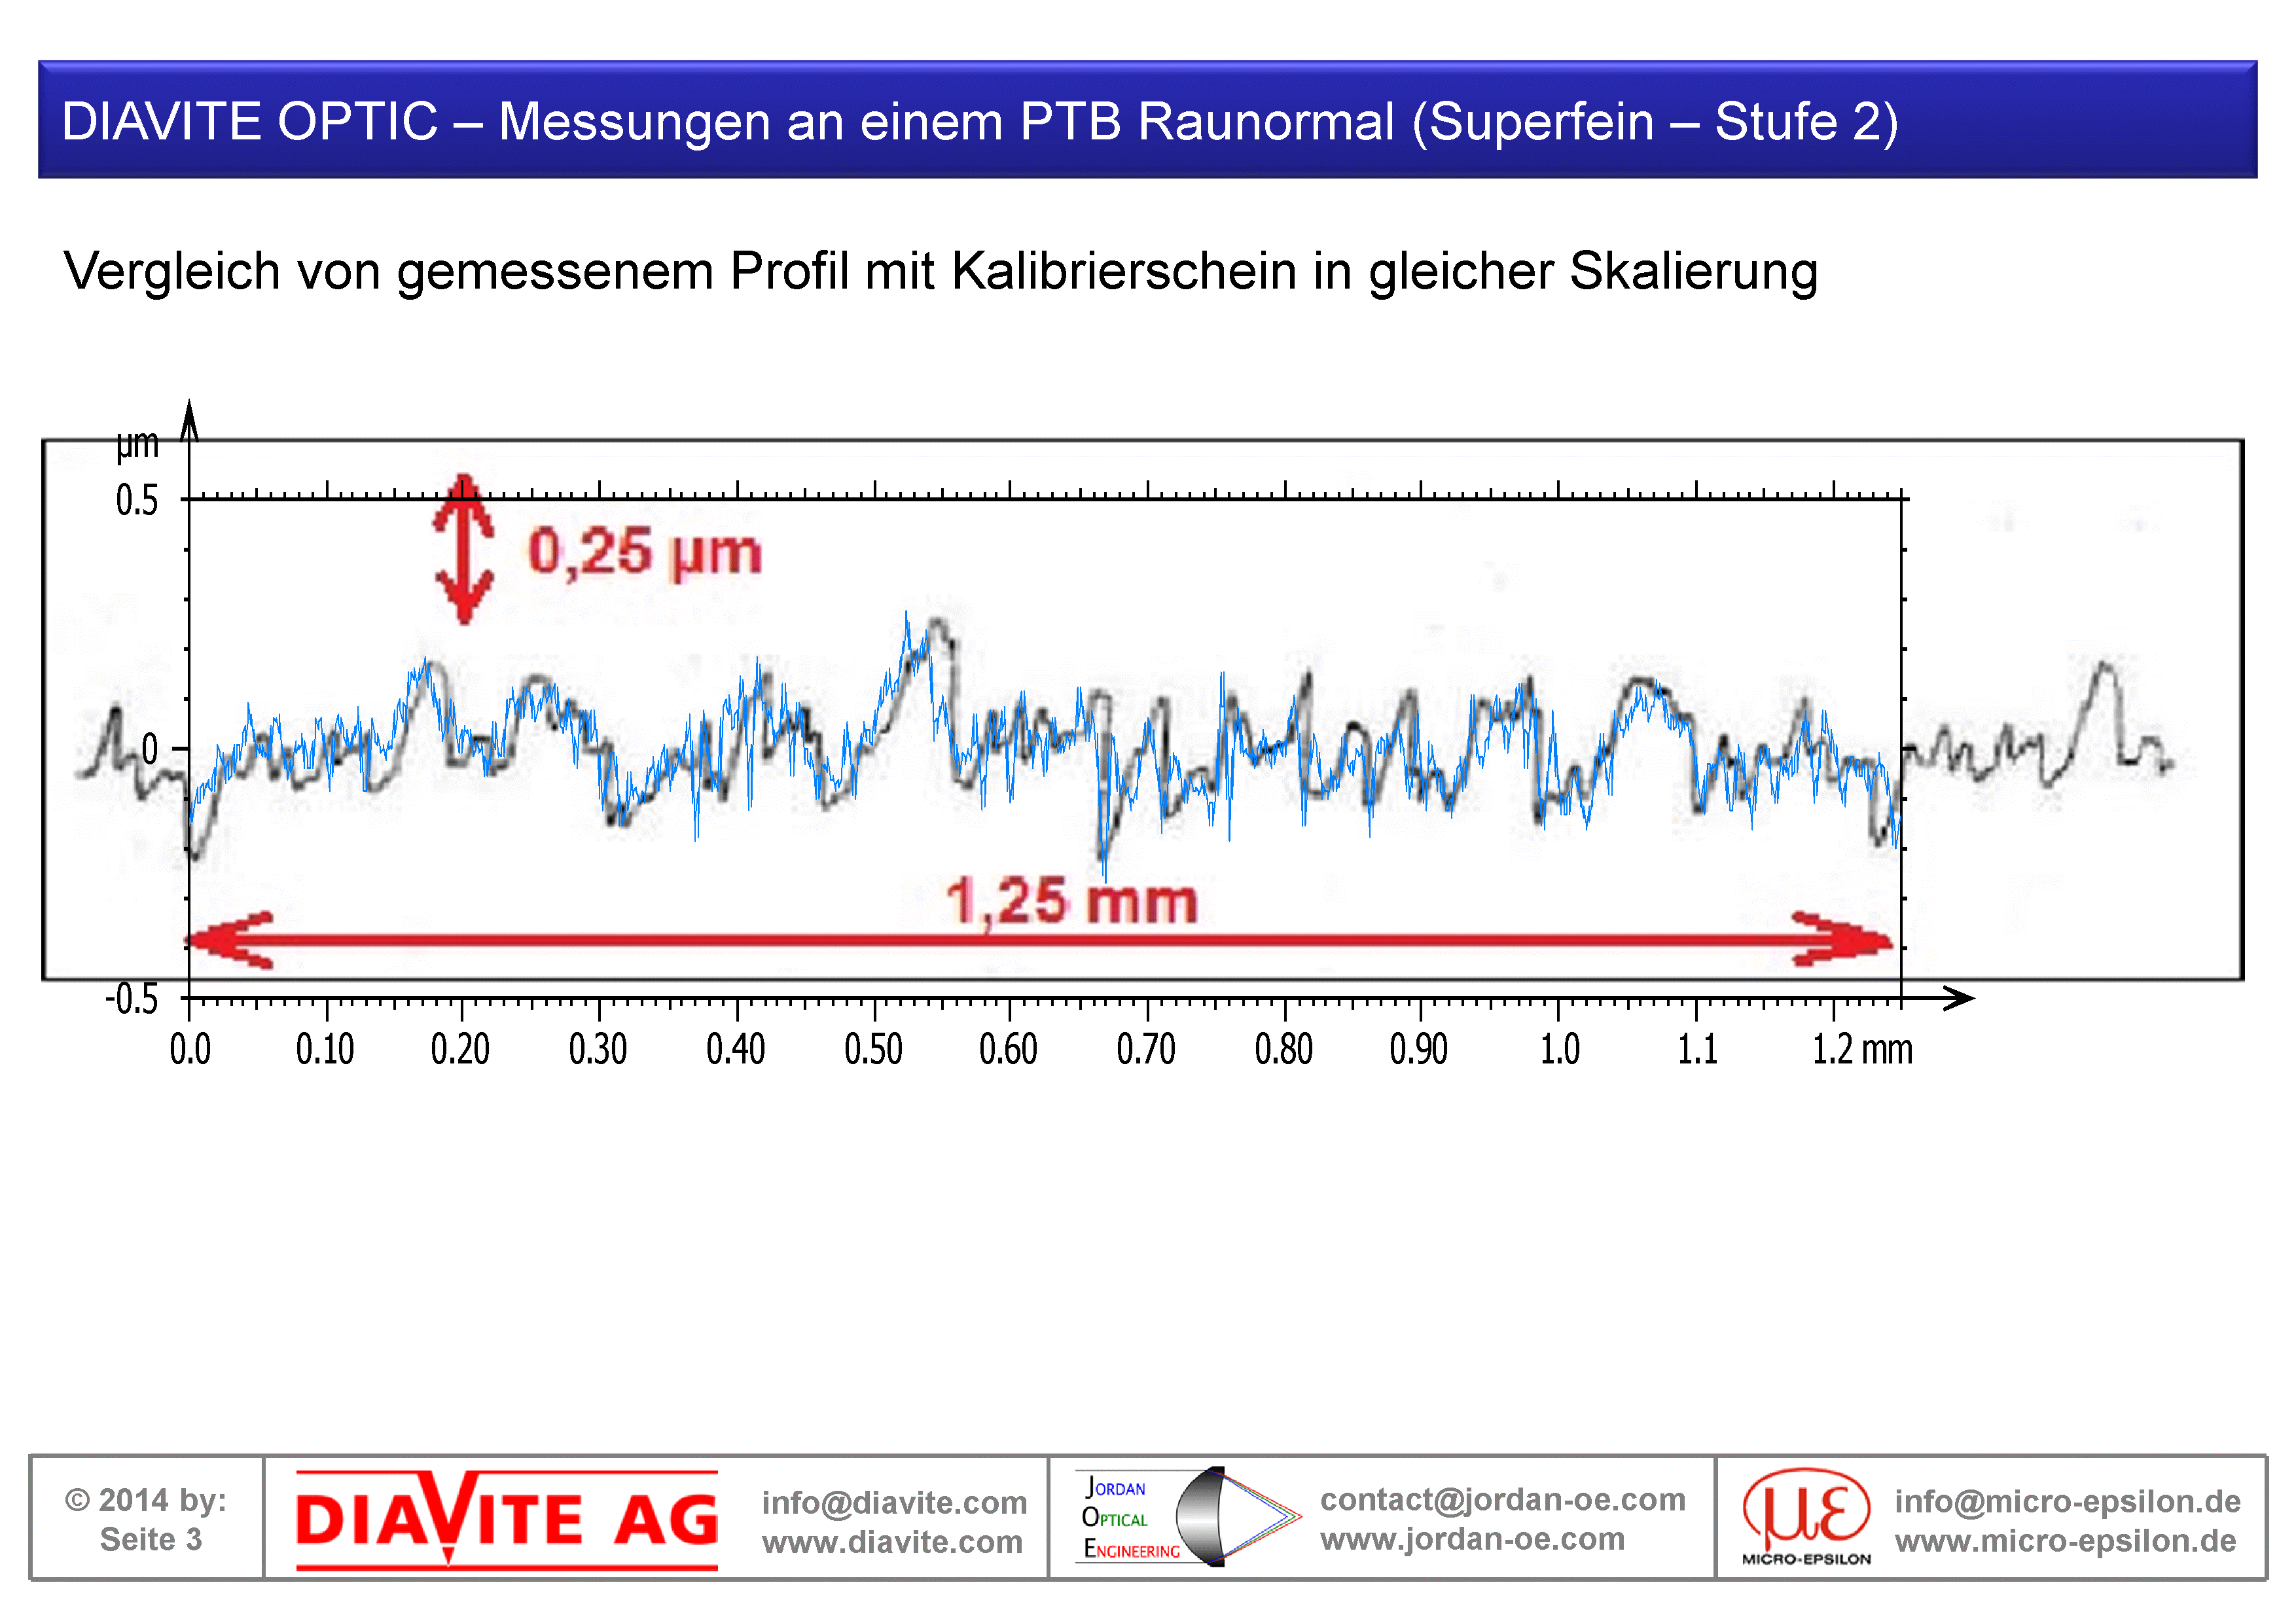
PTB-RN-4070/03 Stage 2
Comparison on a superfine PTB Roughness Standard 4070/03 level 2 (Ra = 60 nm). The left image shows the tactile reference measurement. The middle image shows the optical comparison measurement and the right image the superposition of both profiles.
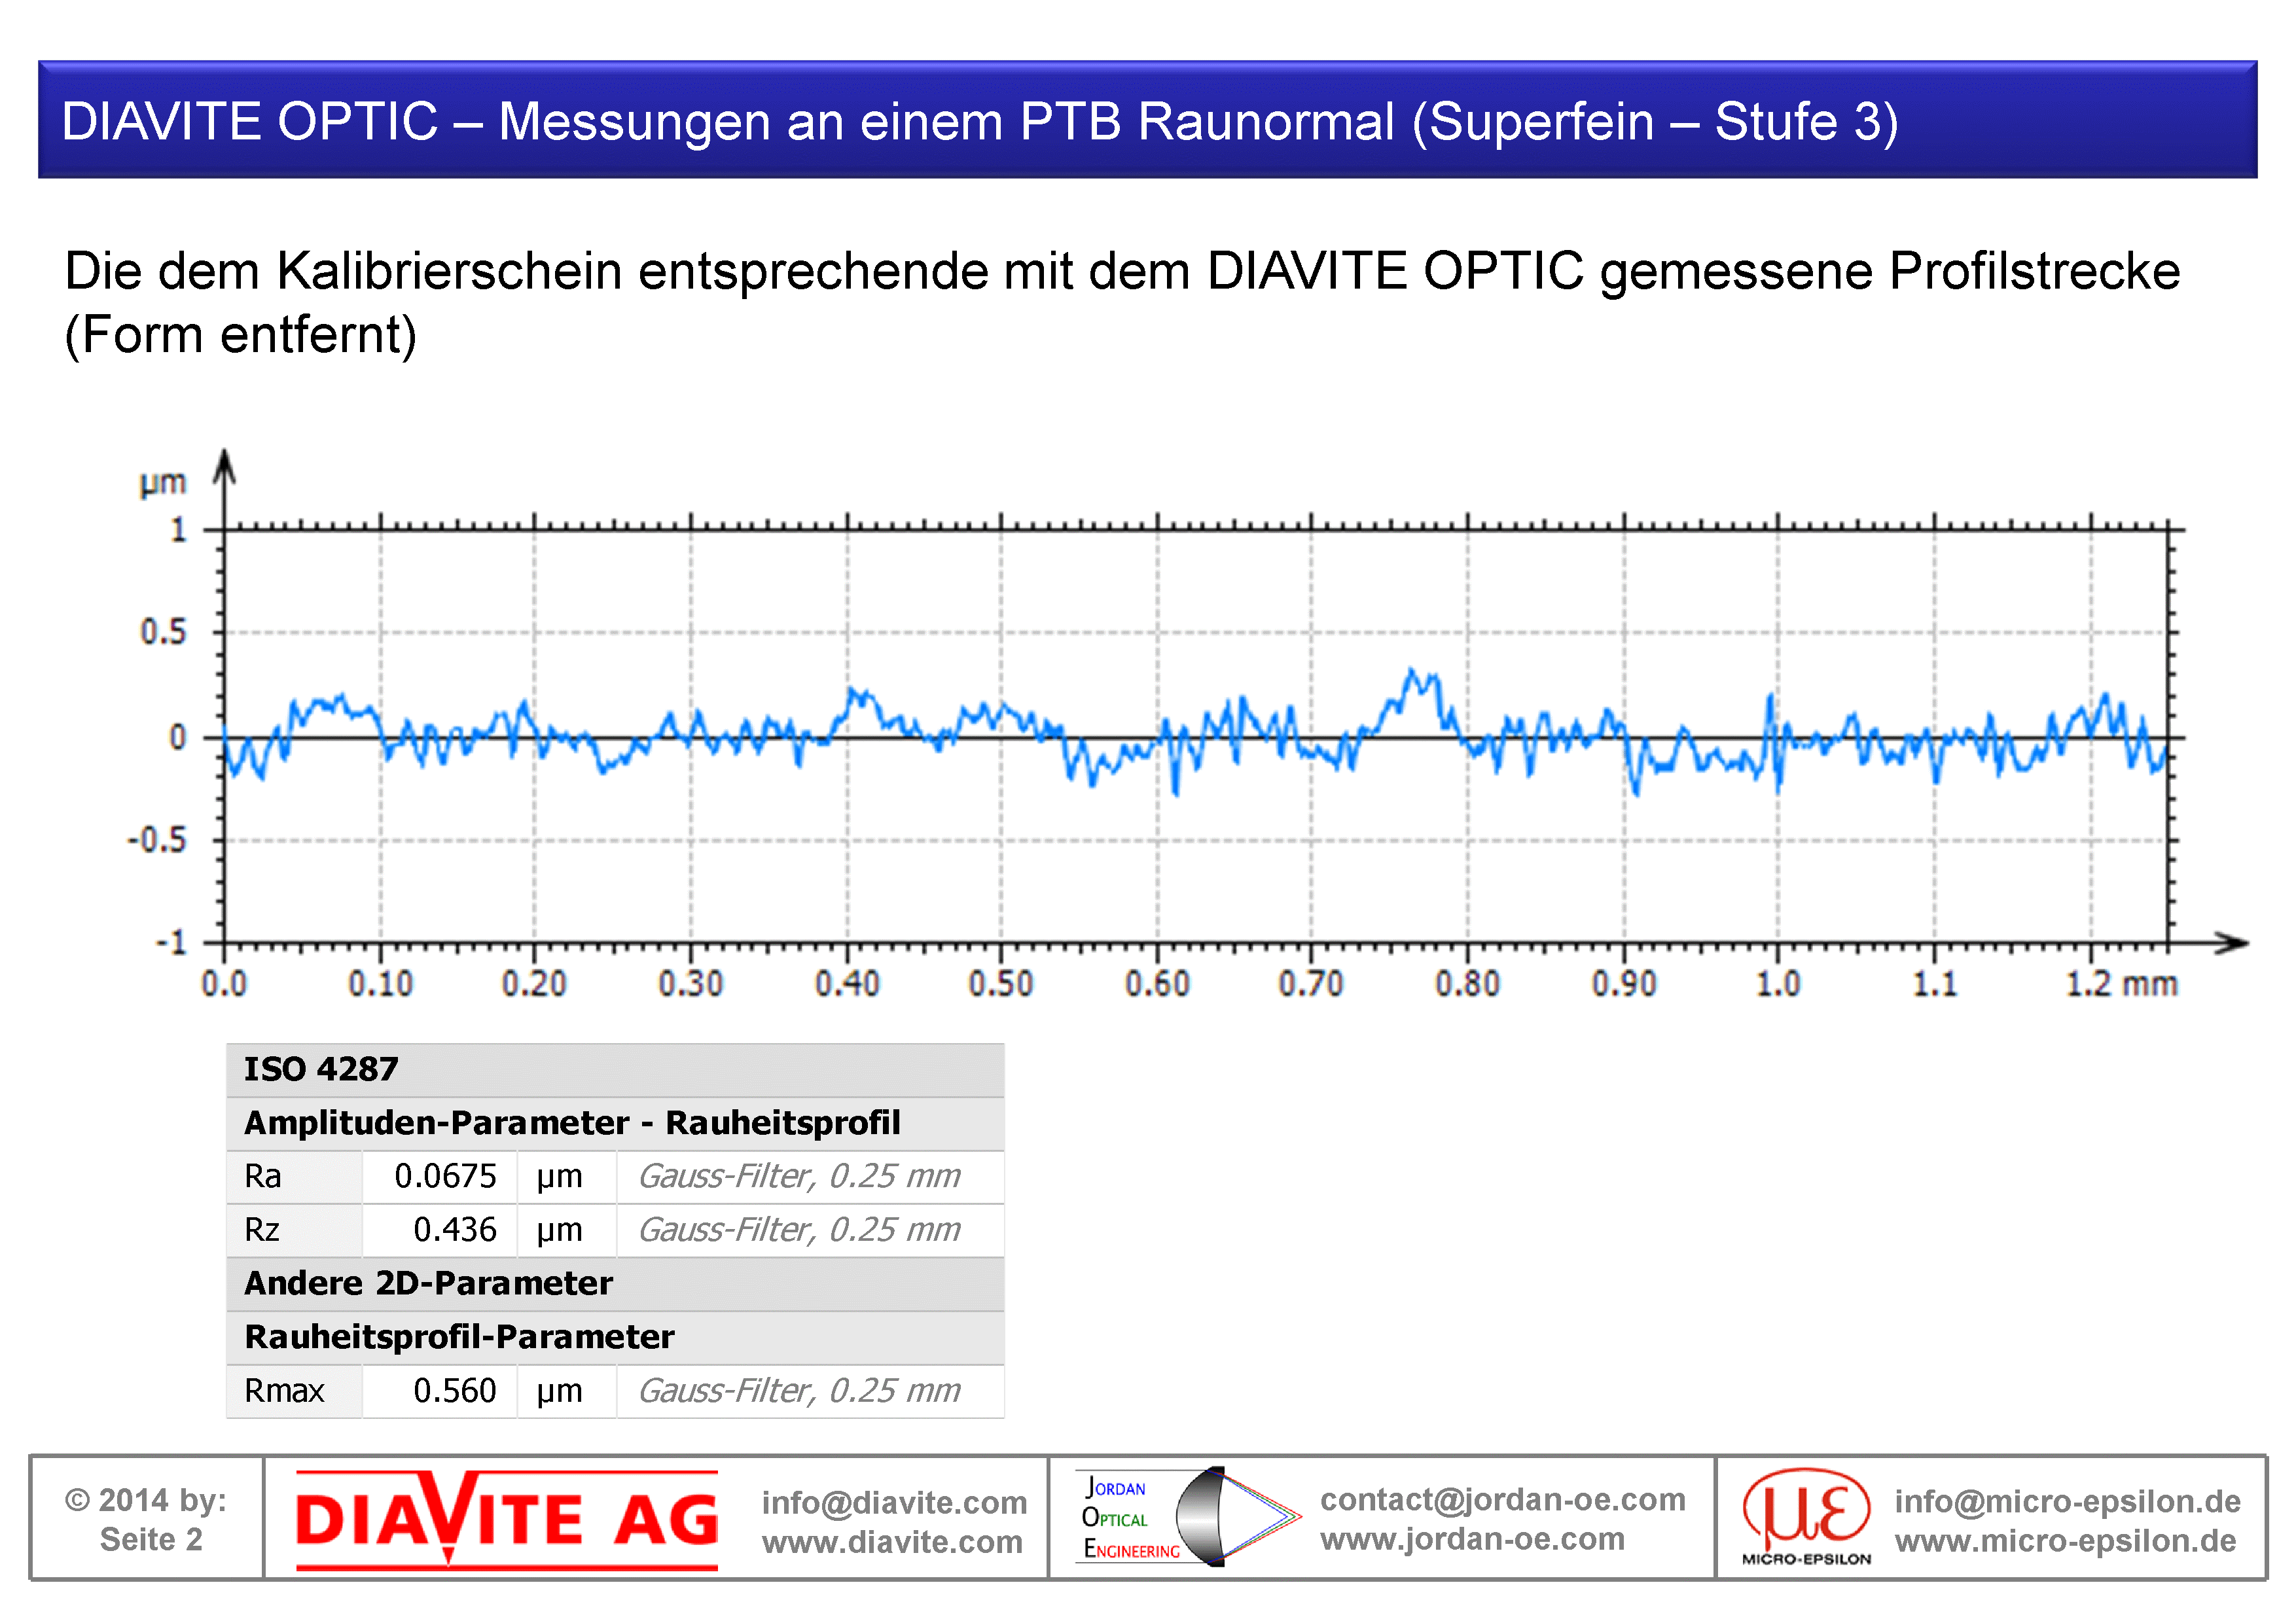
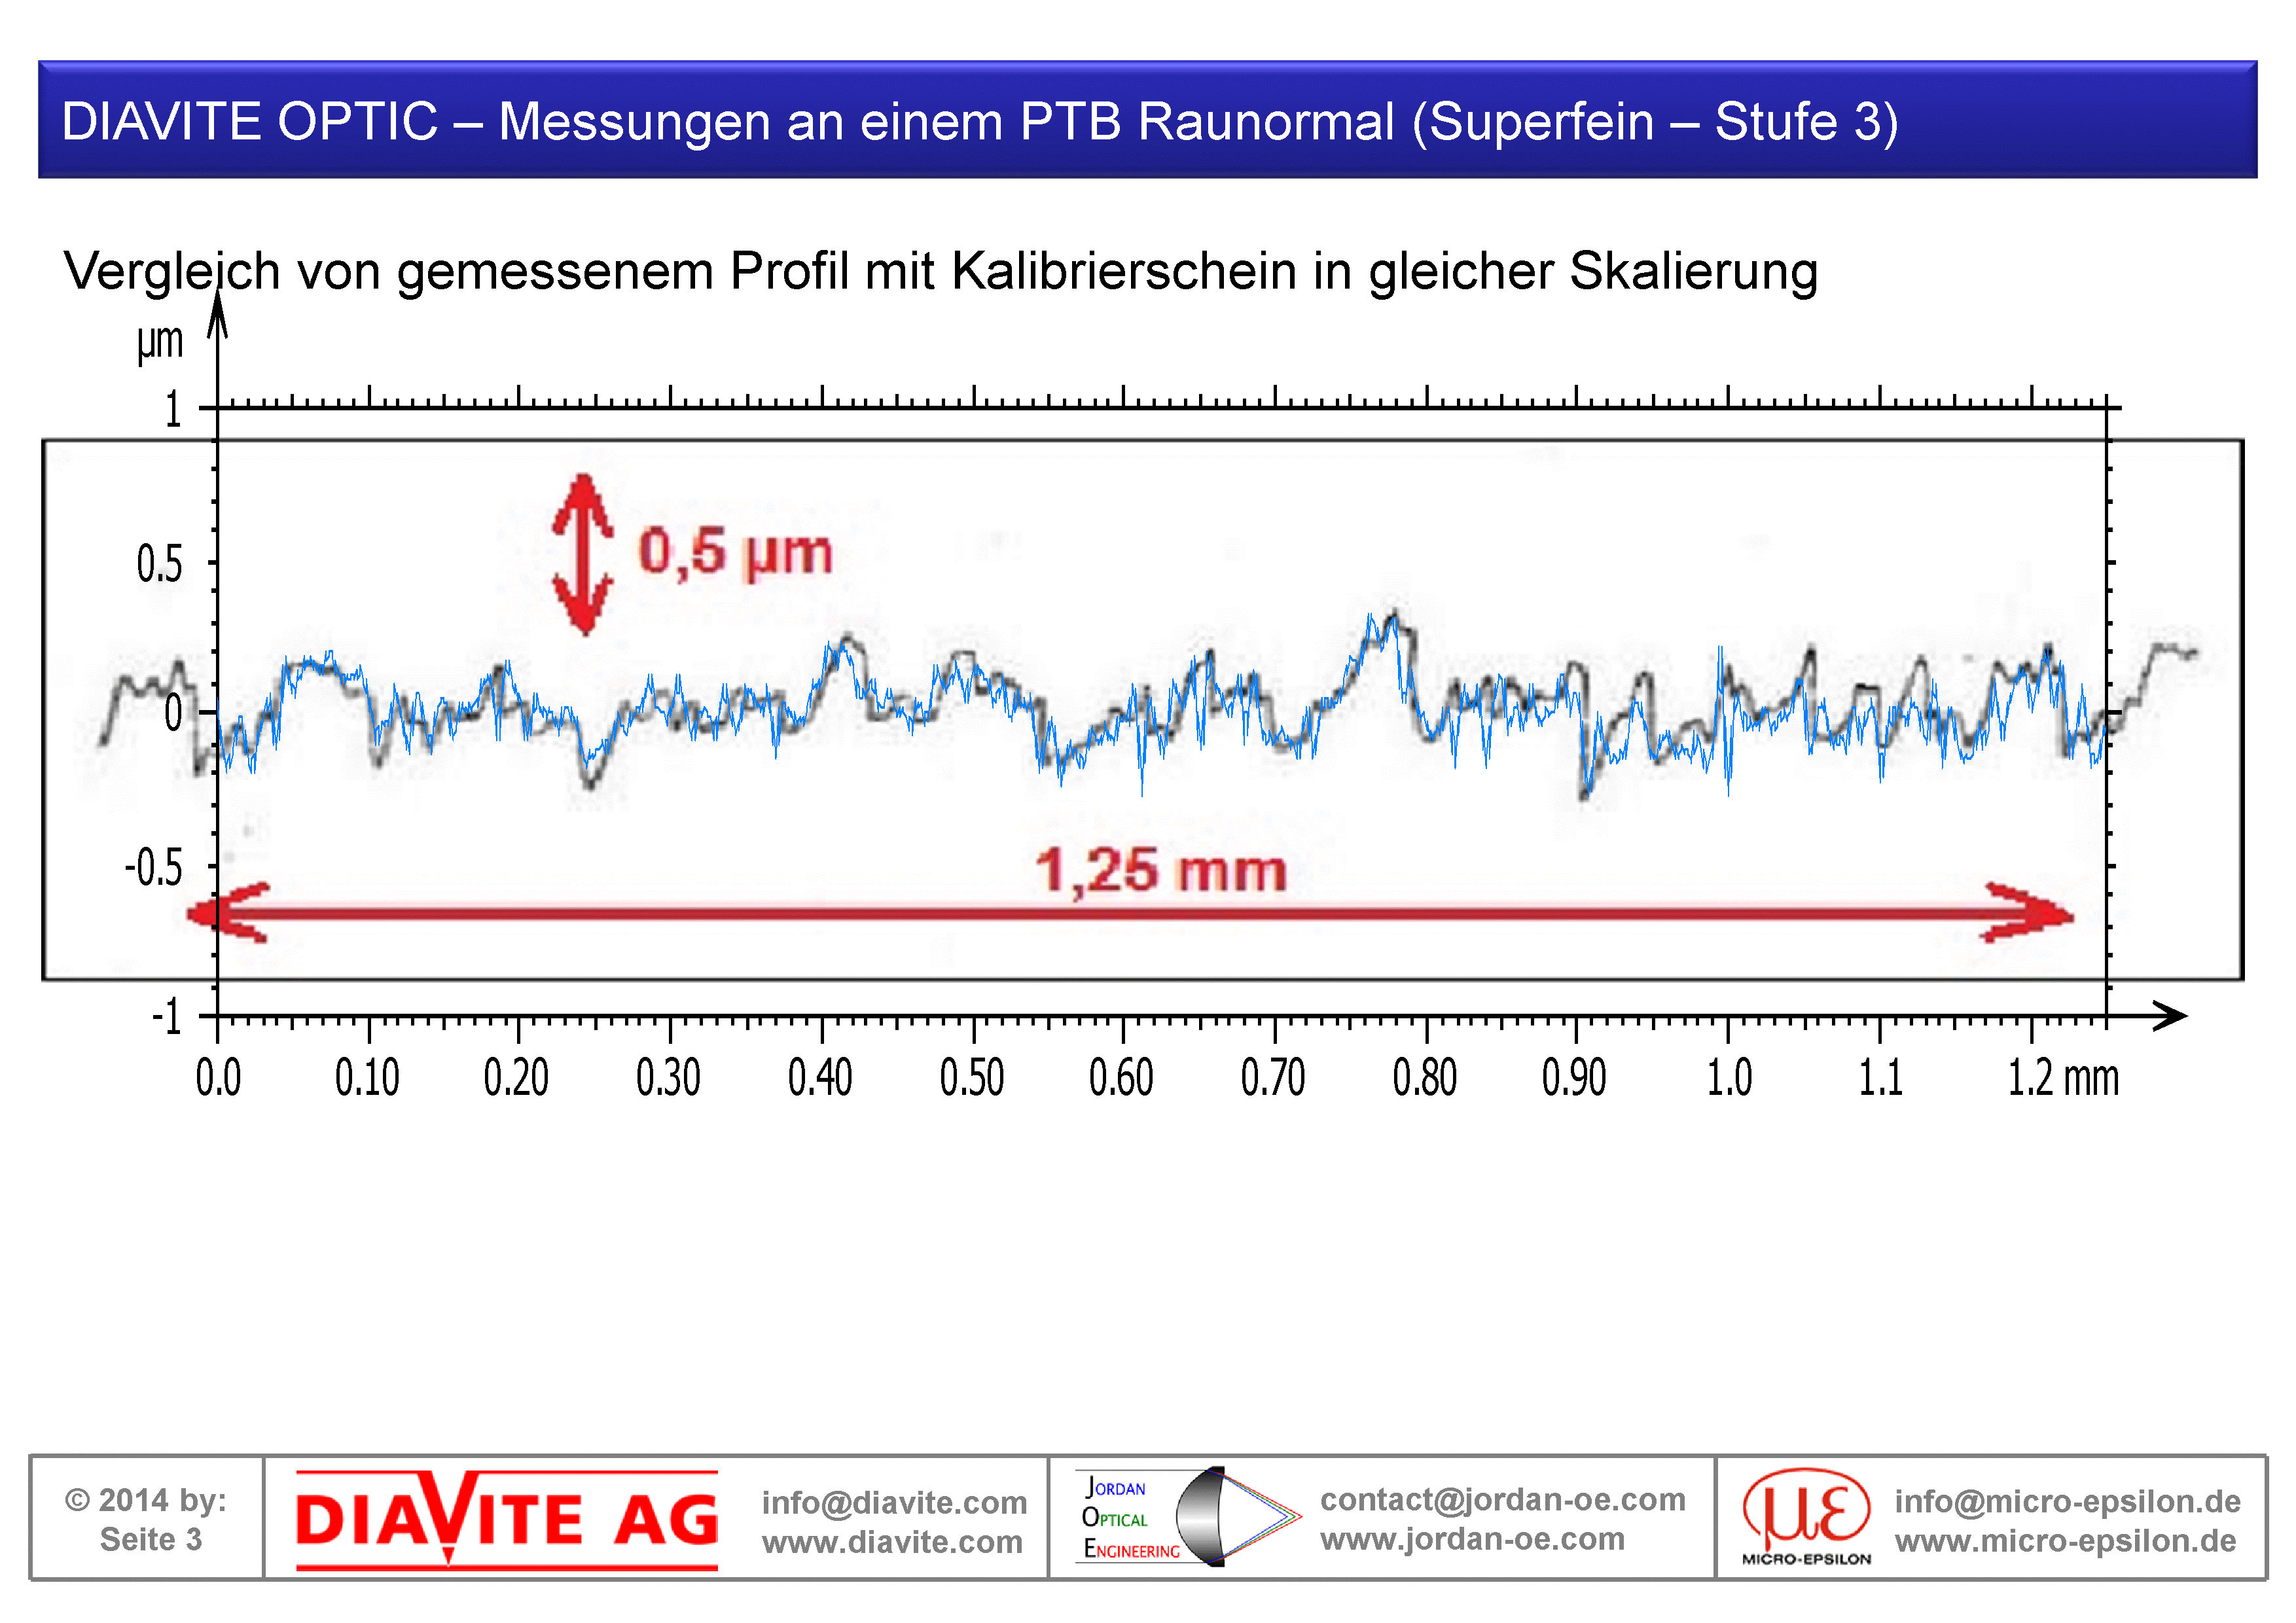
PTB-RN-4070/03 Stage 3
Comparison on a superfine PTB Roughness Standard 4070/03 level 3 (Ra = 82 nm). The left image shows the tactile reference measurement. The middle image shows the optical comparison measurement and the right image the superposition of both profiles.

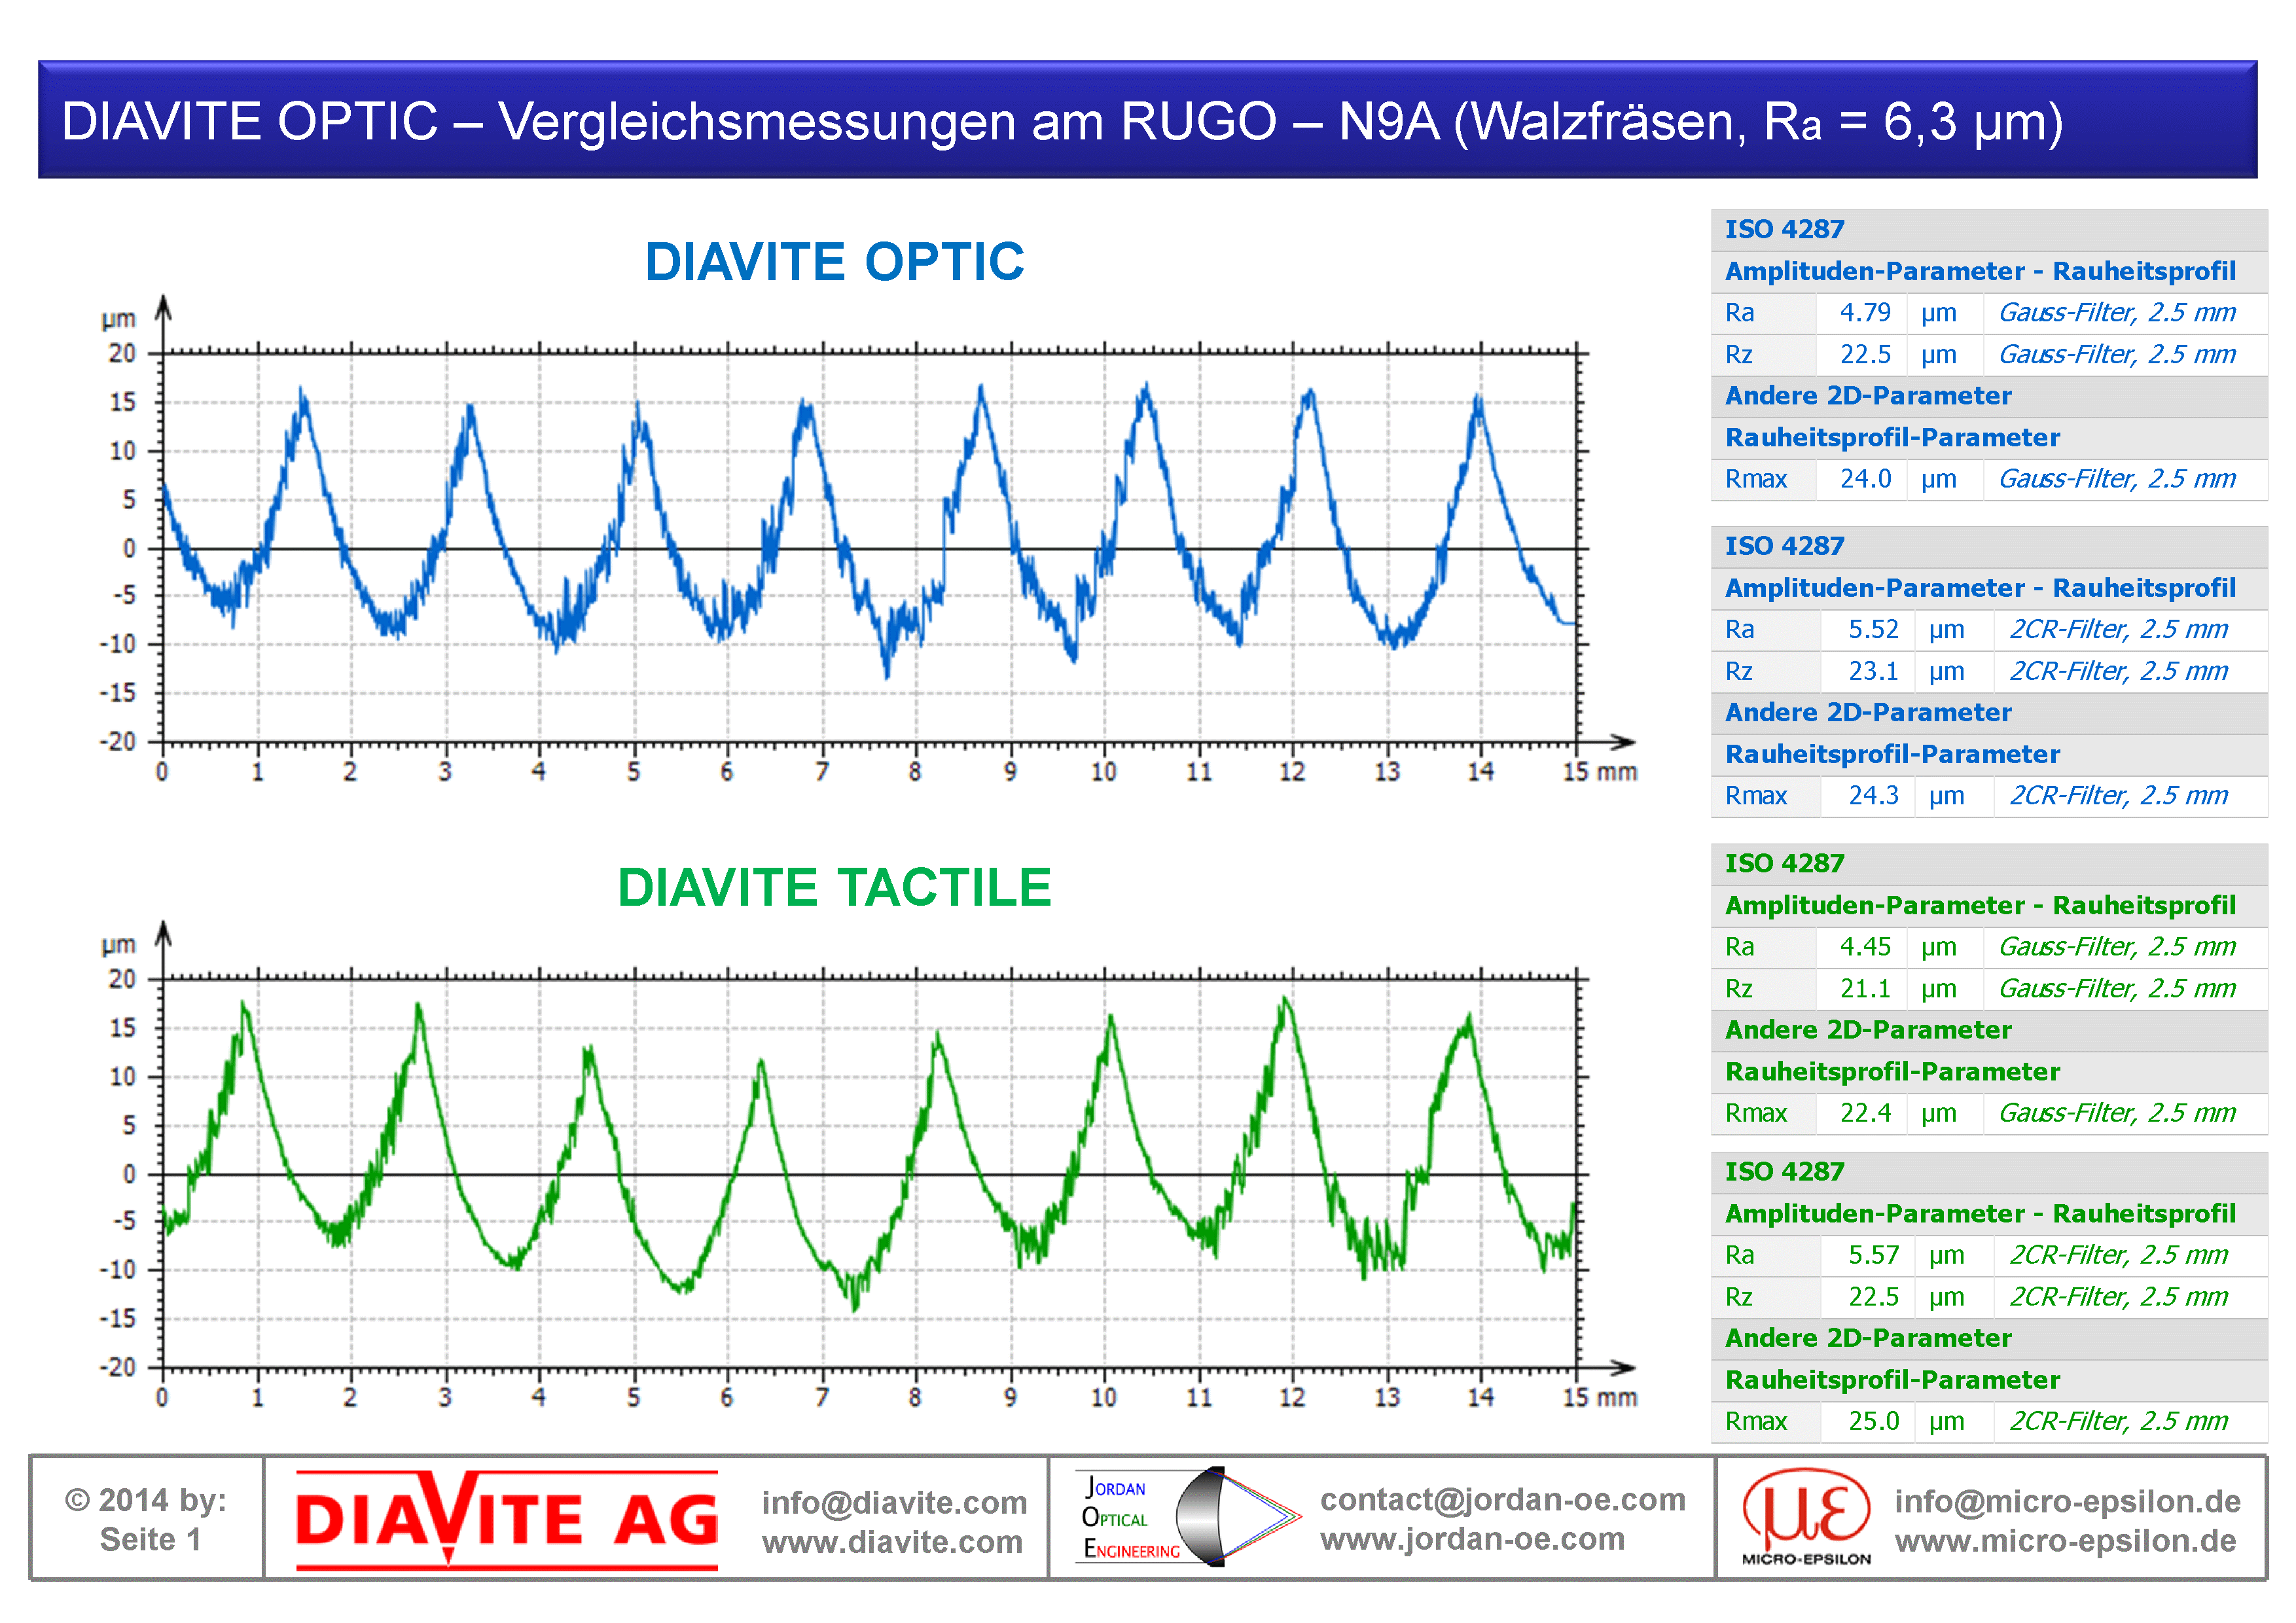
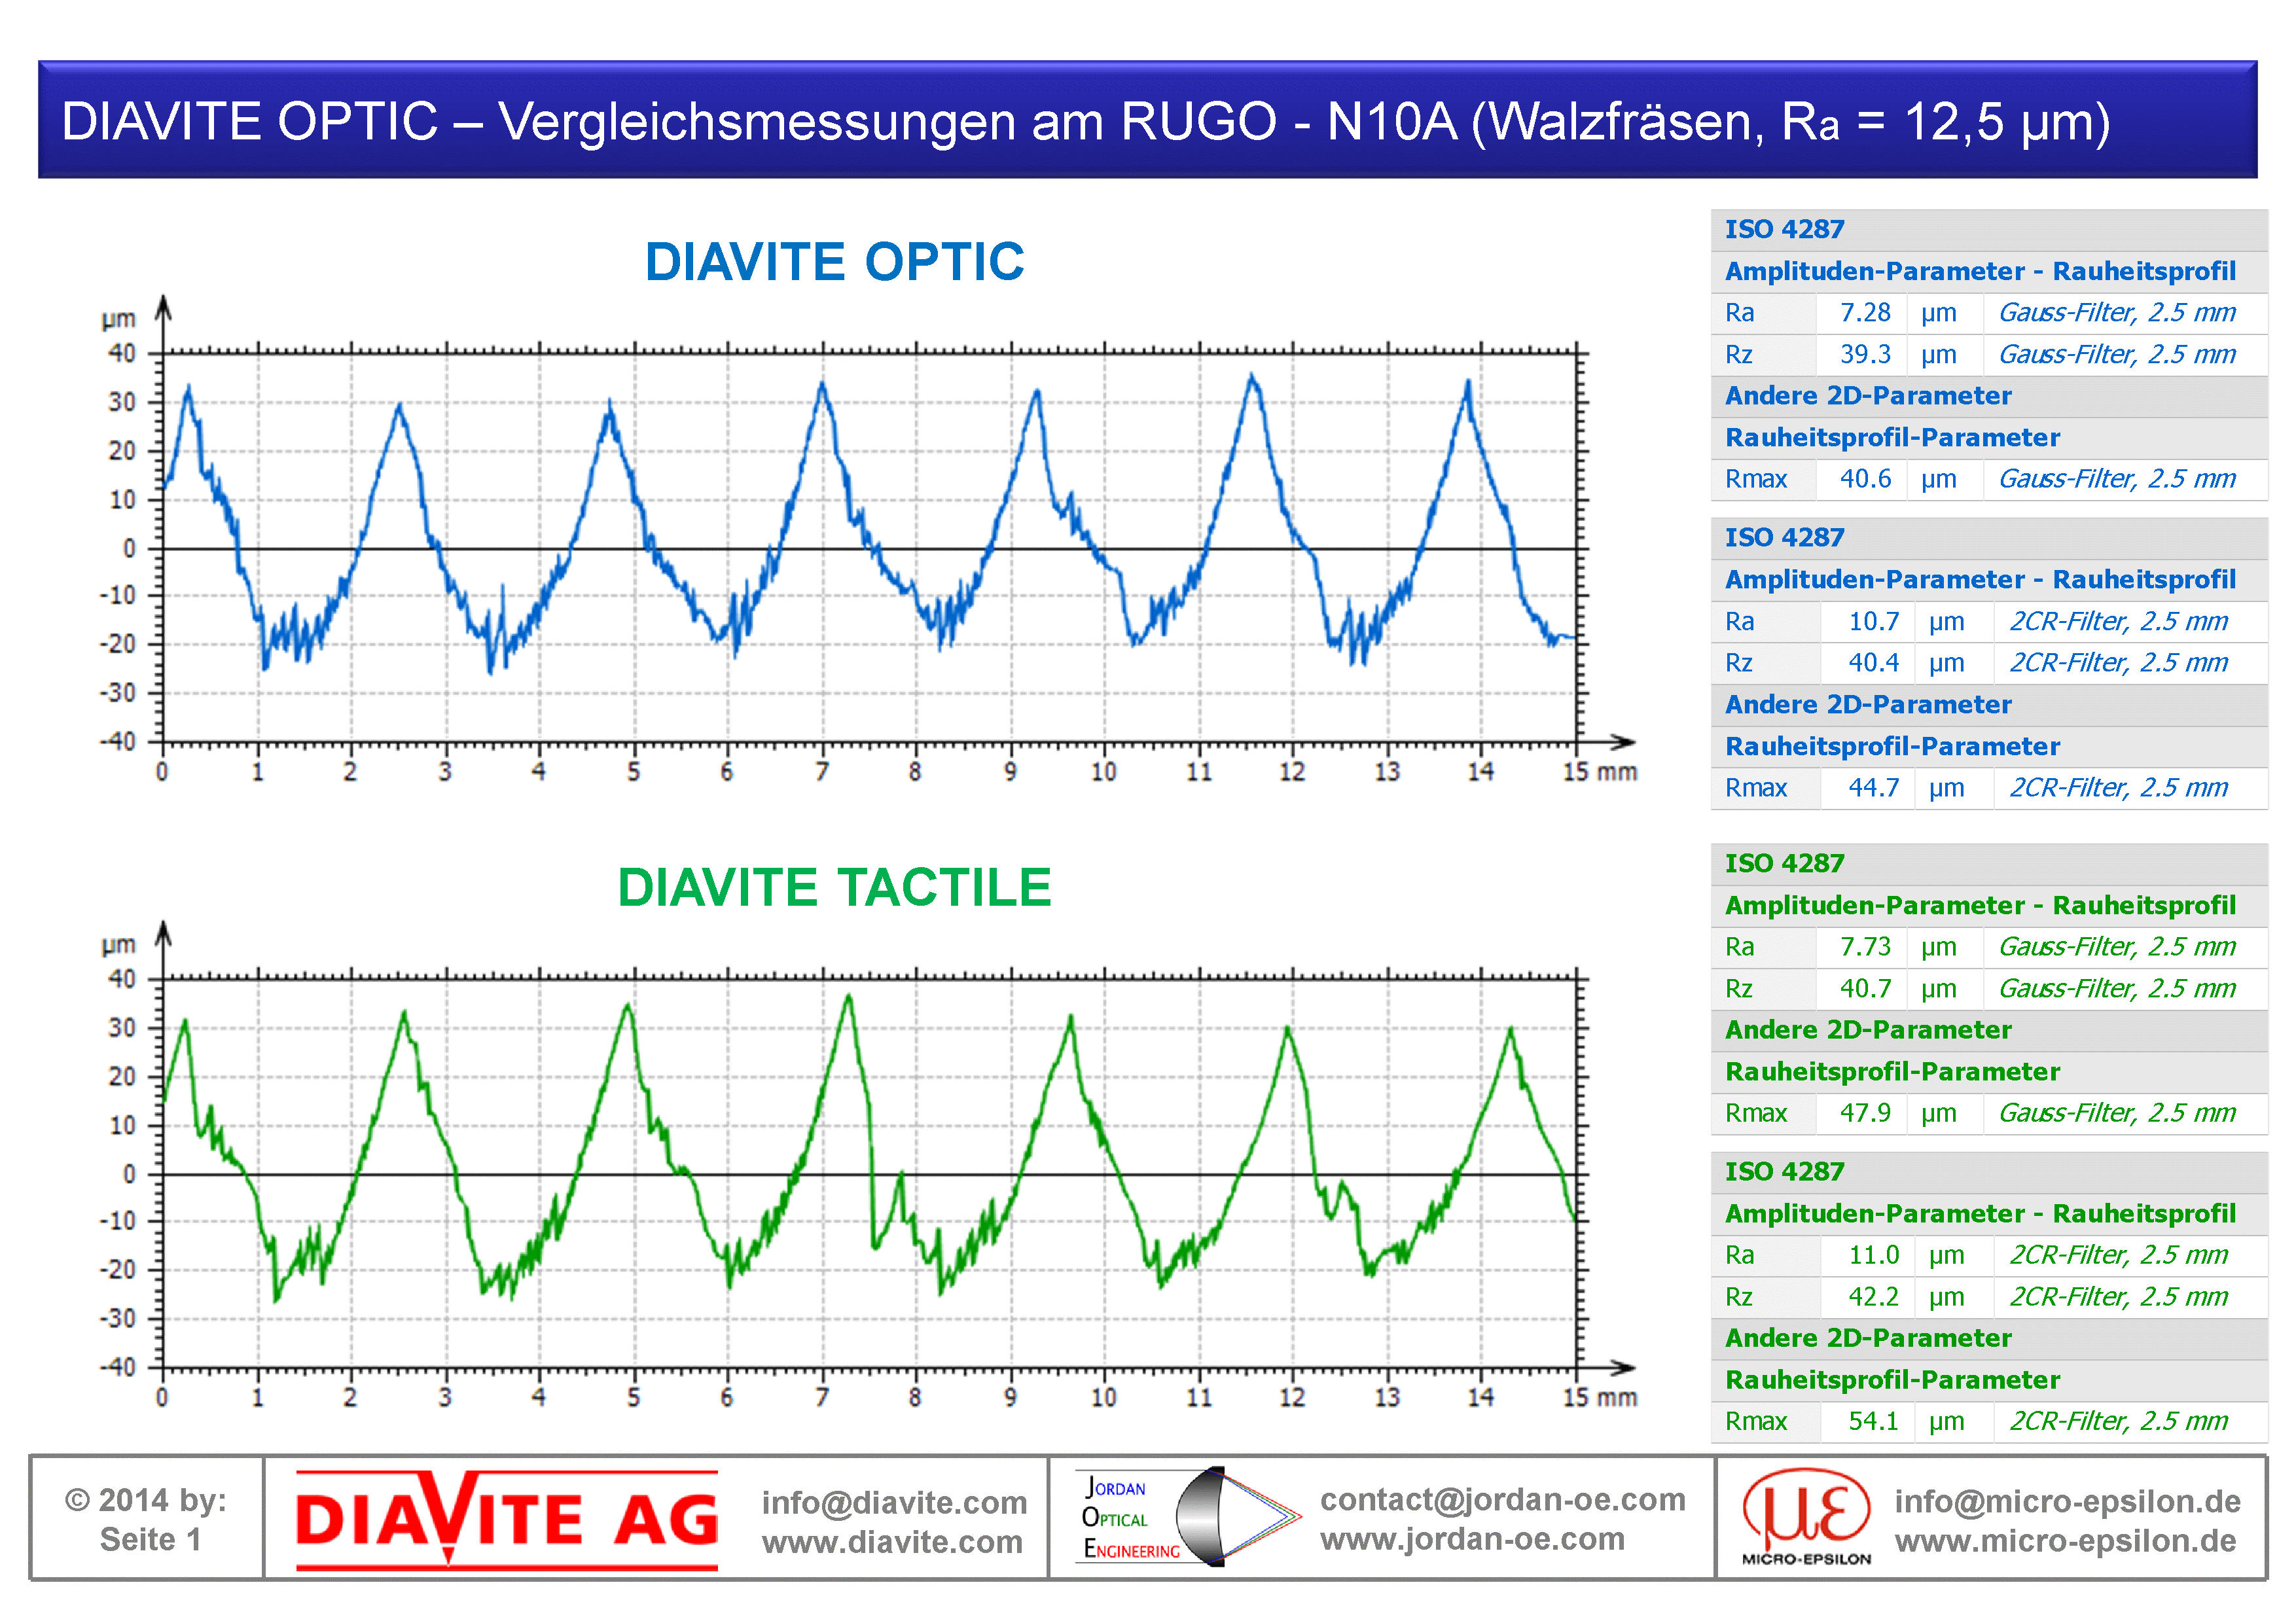
Measurements on the reference standard RUGOTEST 1
RUGO-N8A (Ra 3,2 µm), RUGO-N9A (Ra 6,3 µm), RUGO-N10A (Ra 12,5 µm)
Roll-milled surfaces are primarily one-dimensionally rough and can therefore be compared well via profile sections.
Comparison of optical measurements (blue profiles) and tactile comparison measurements (green profiles) on three roll-milled surfaces.

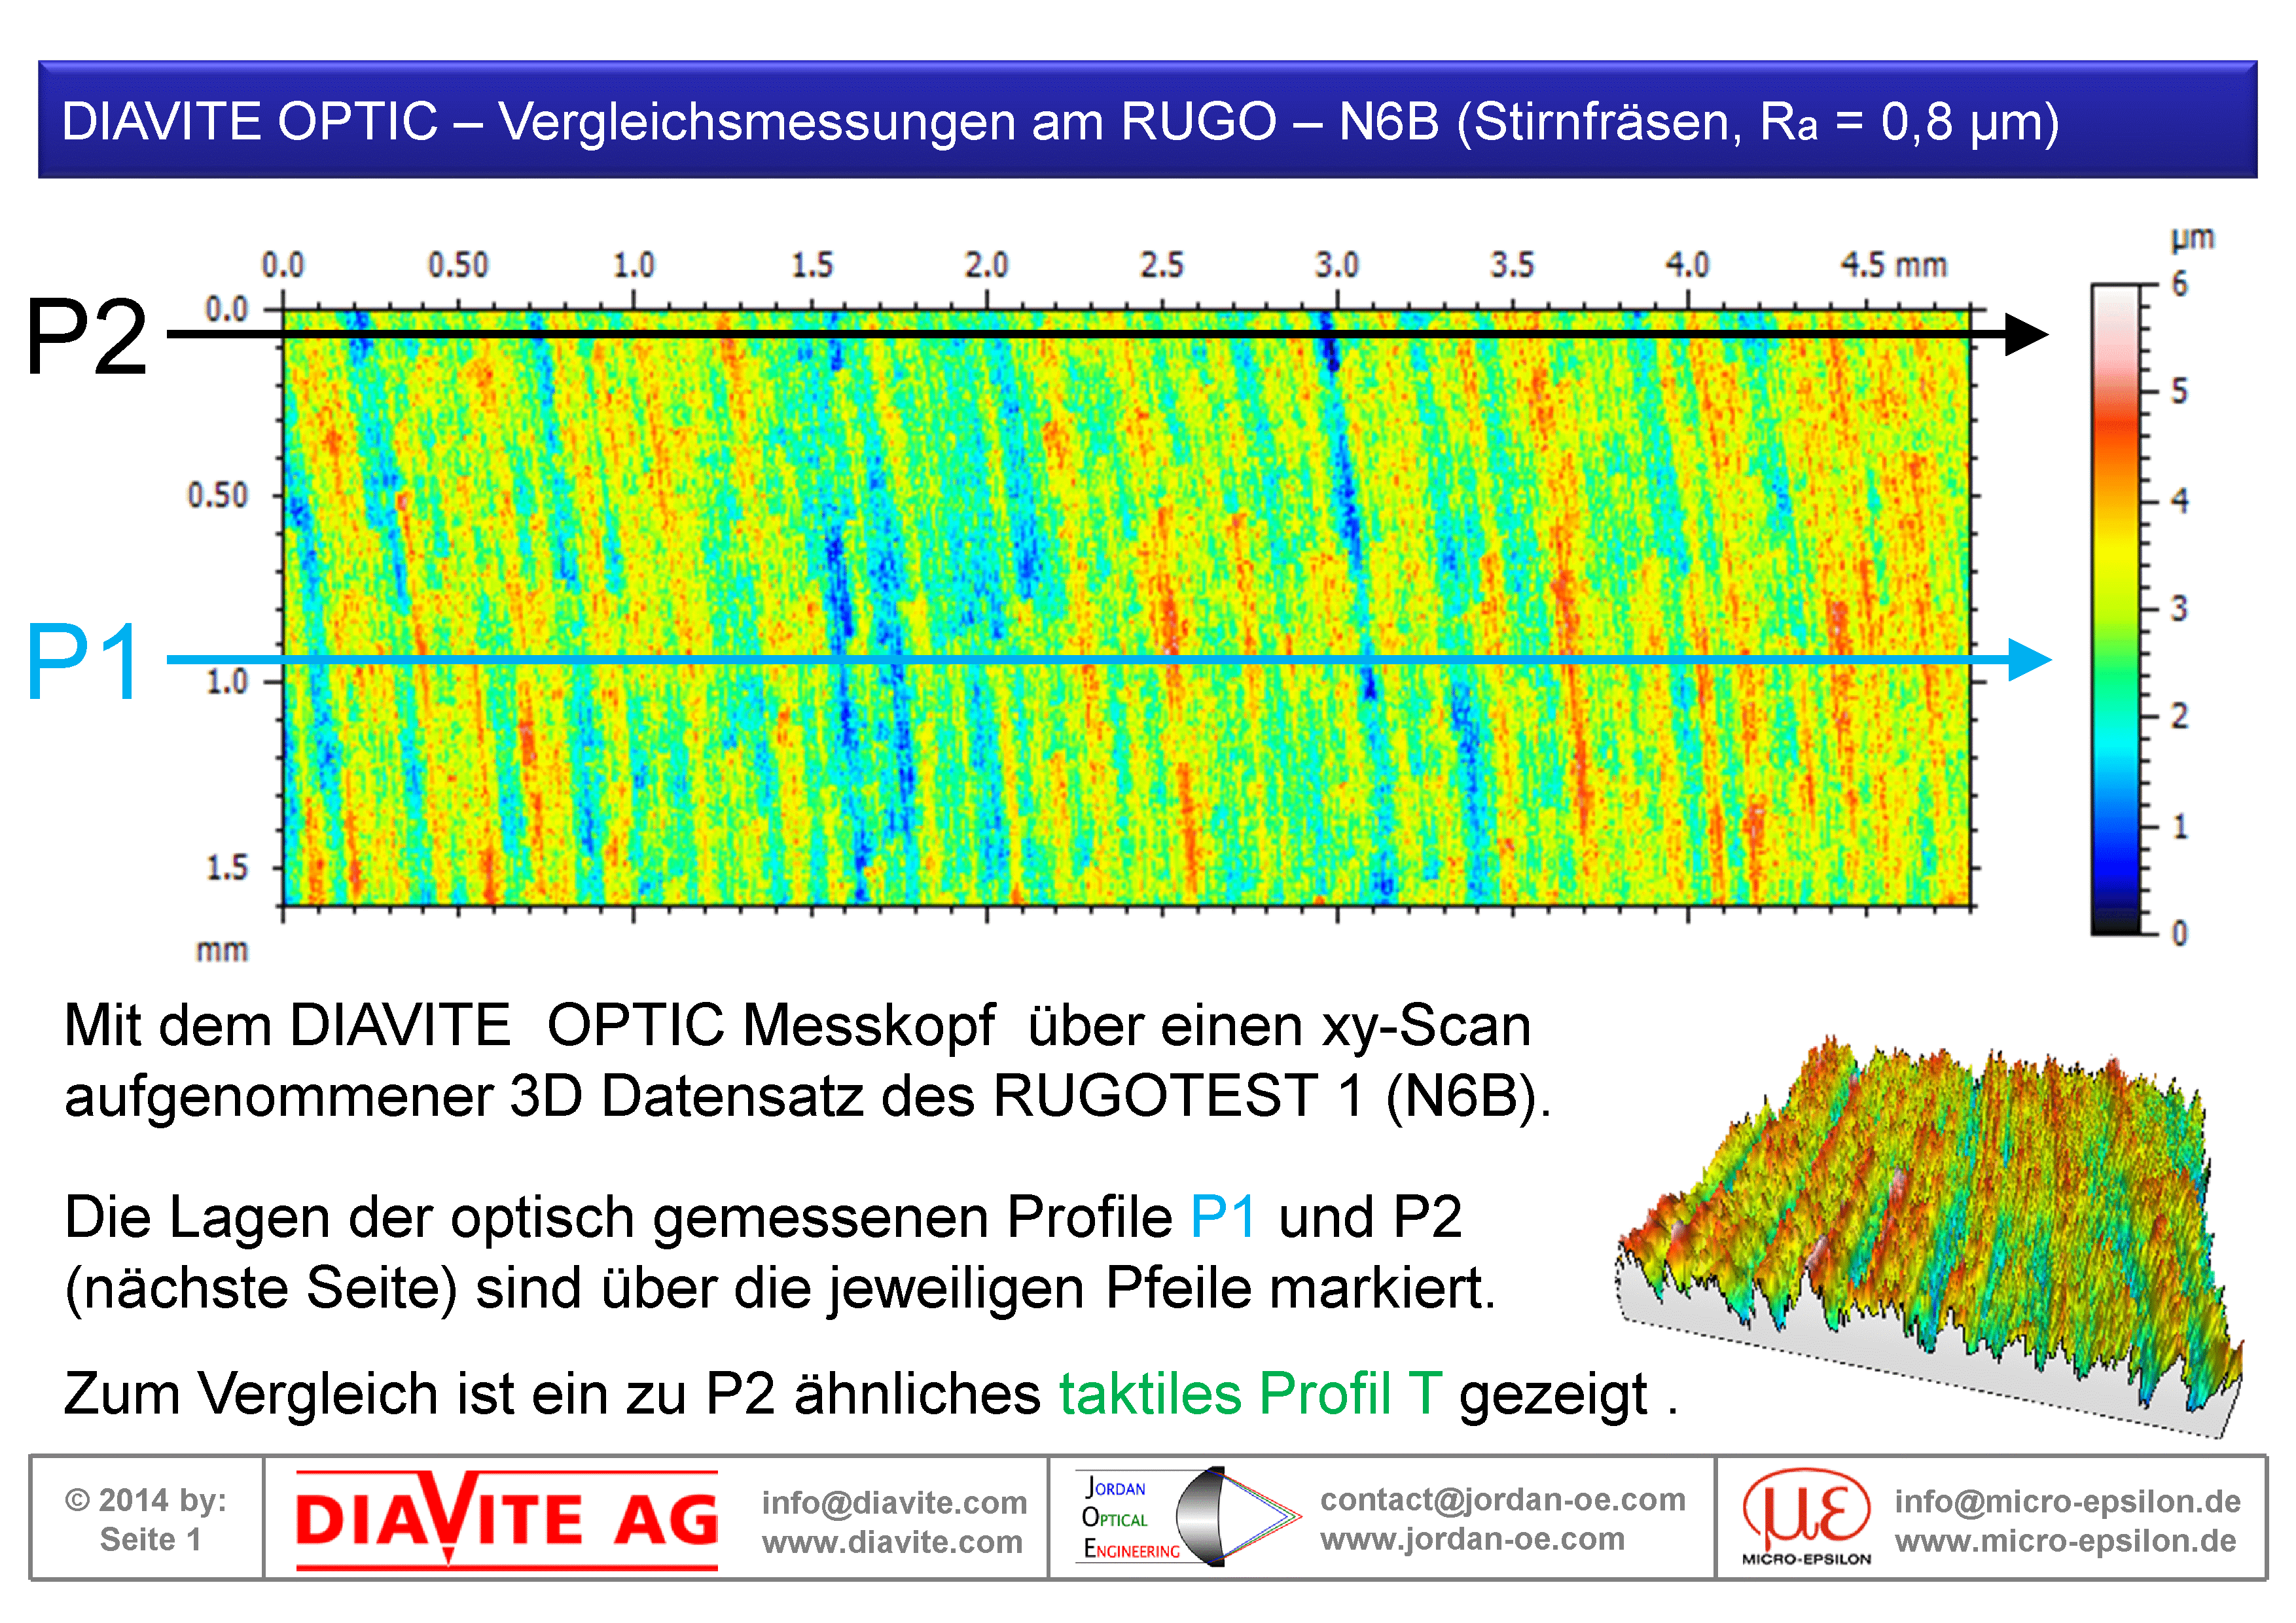
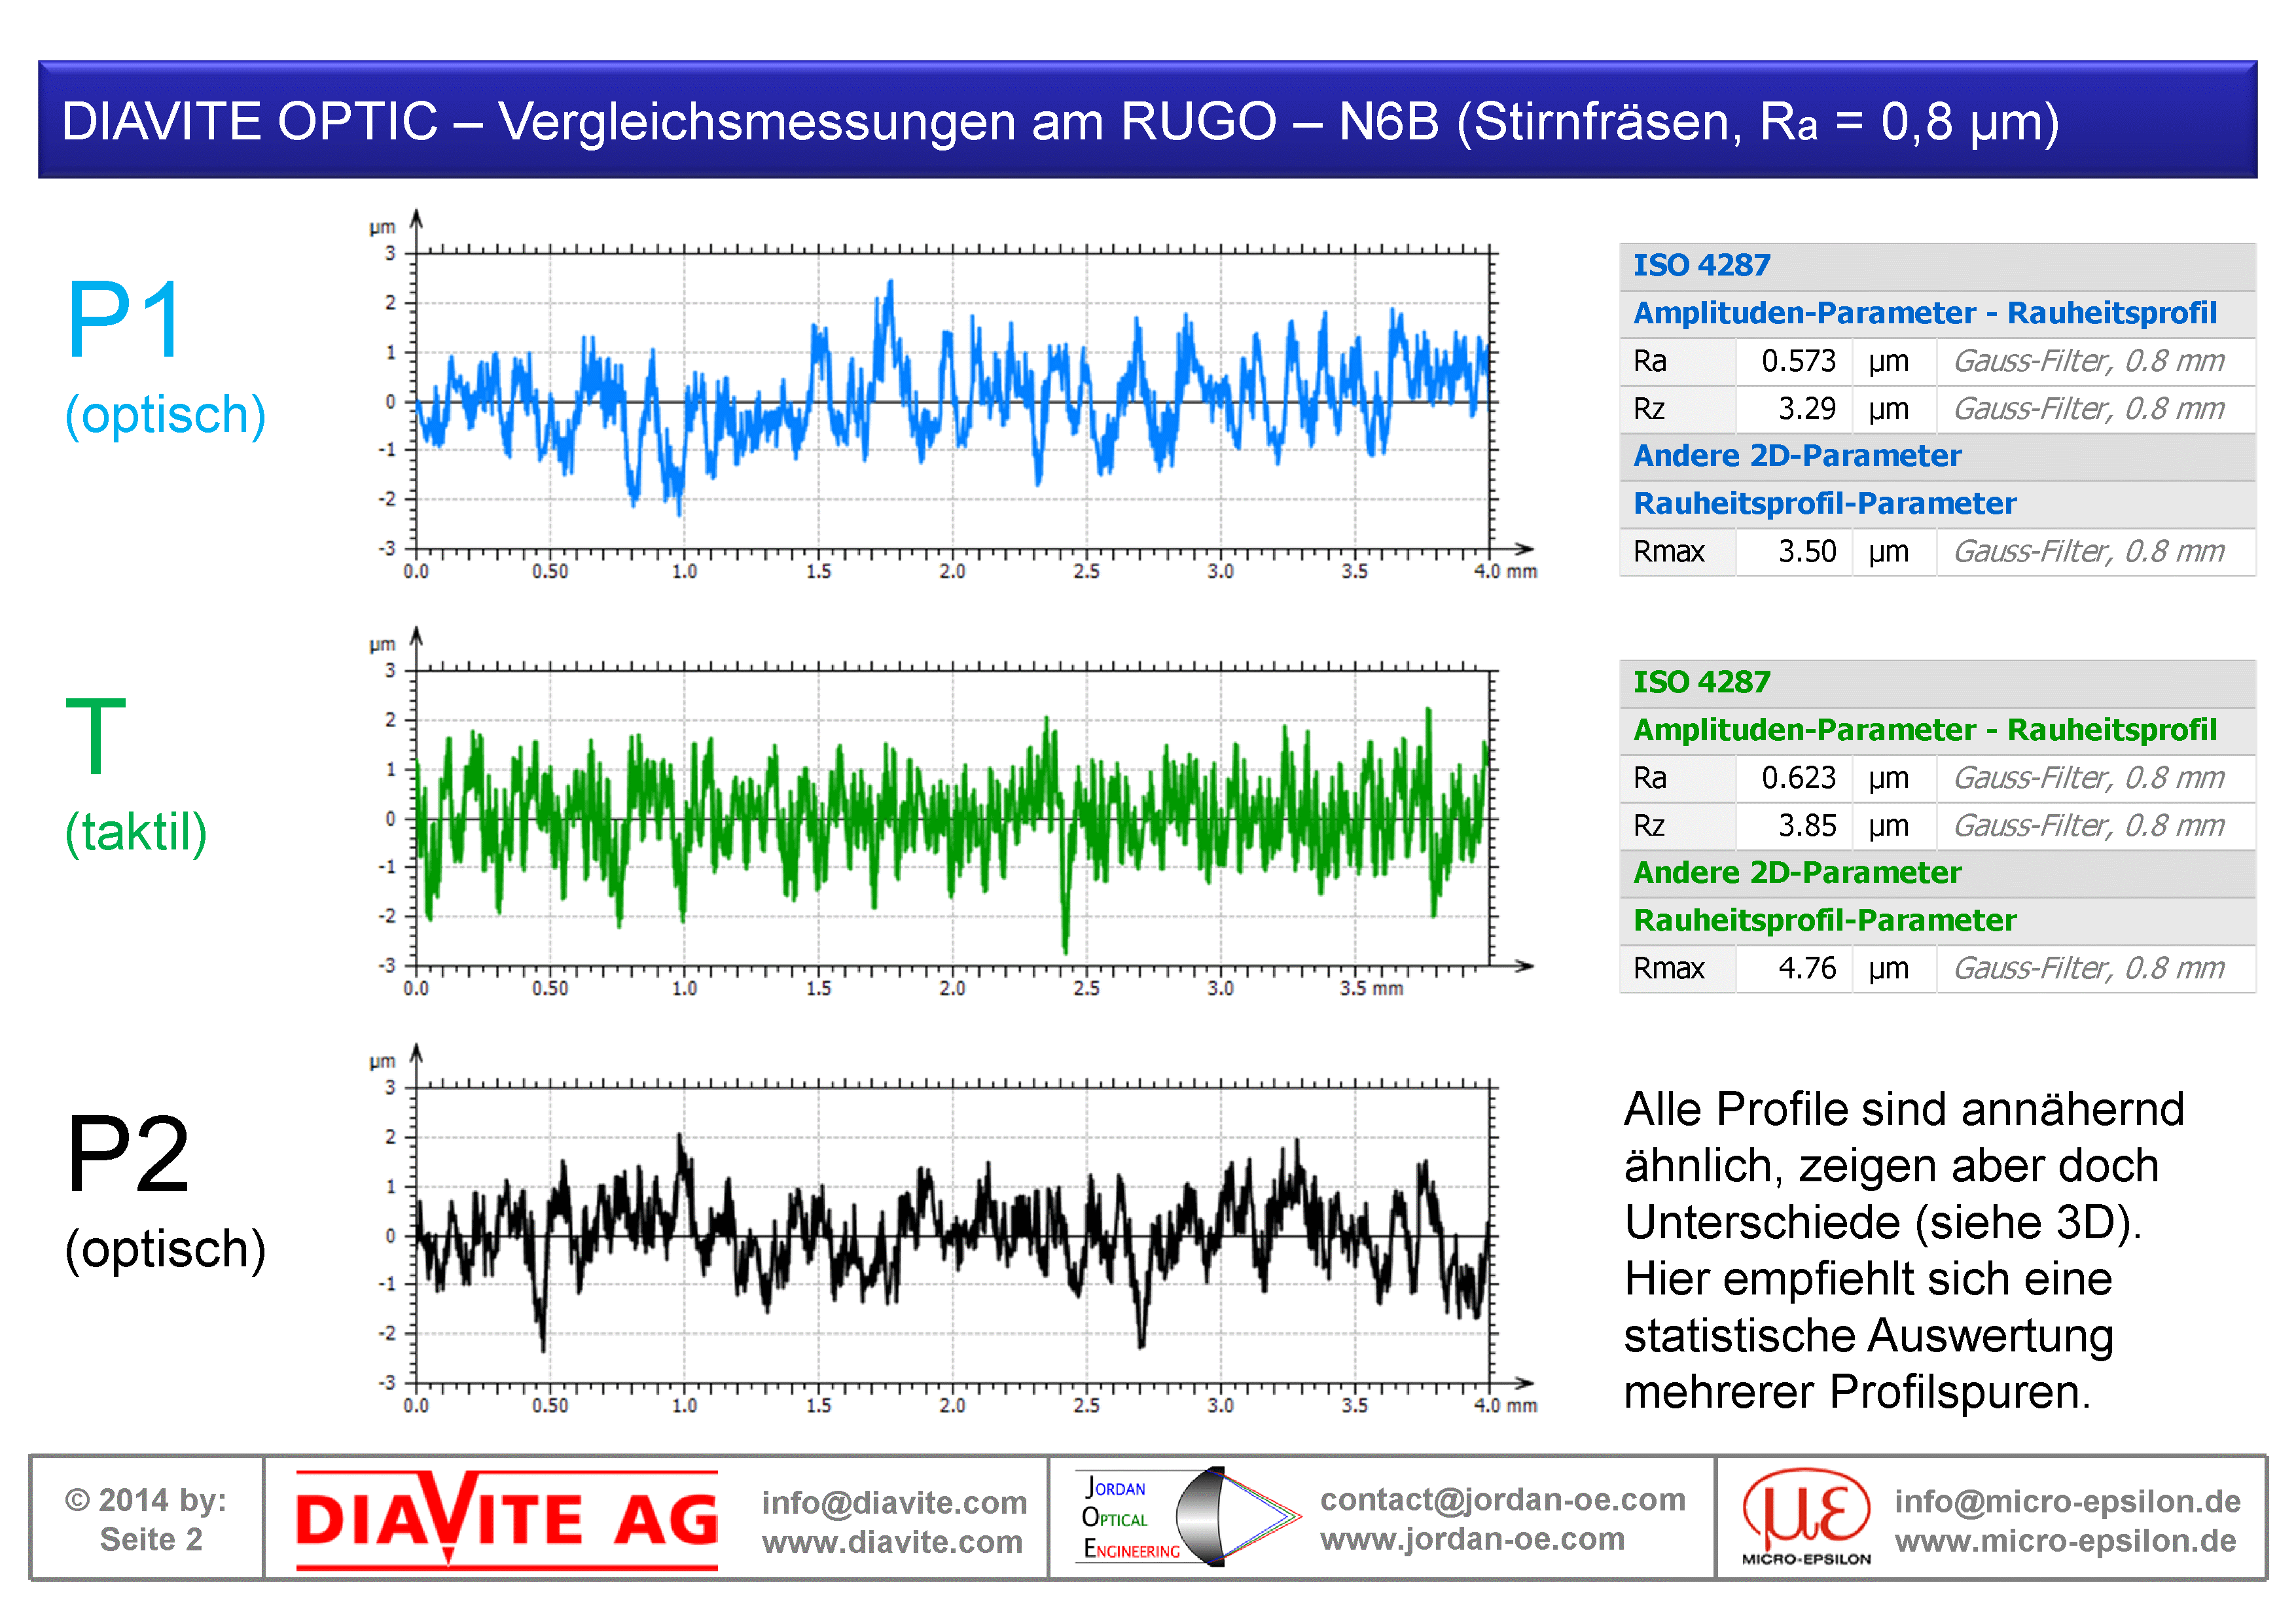
RUGO-N6B (Ra 0,8 µm)
Face-milled surfaces tend to be two-dimensionally rough and therefore require an areal measurement (left image).
In the right image, two optical profiles P1 (blue) and P2 (black) are extracted from the areal measurement. For comparison, a tactile profile T (green) is also shown.
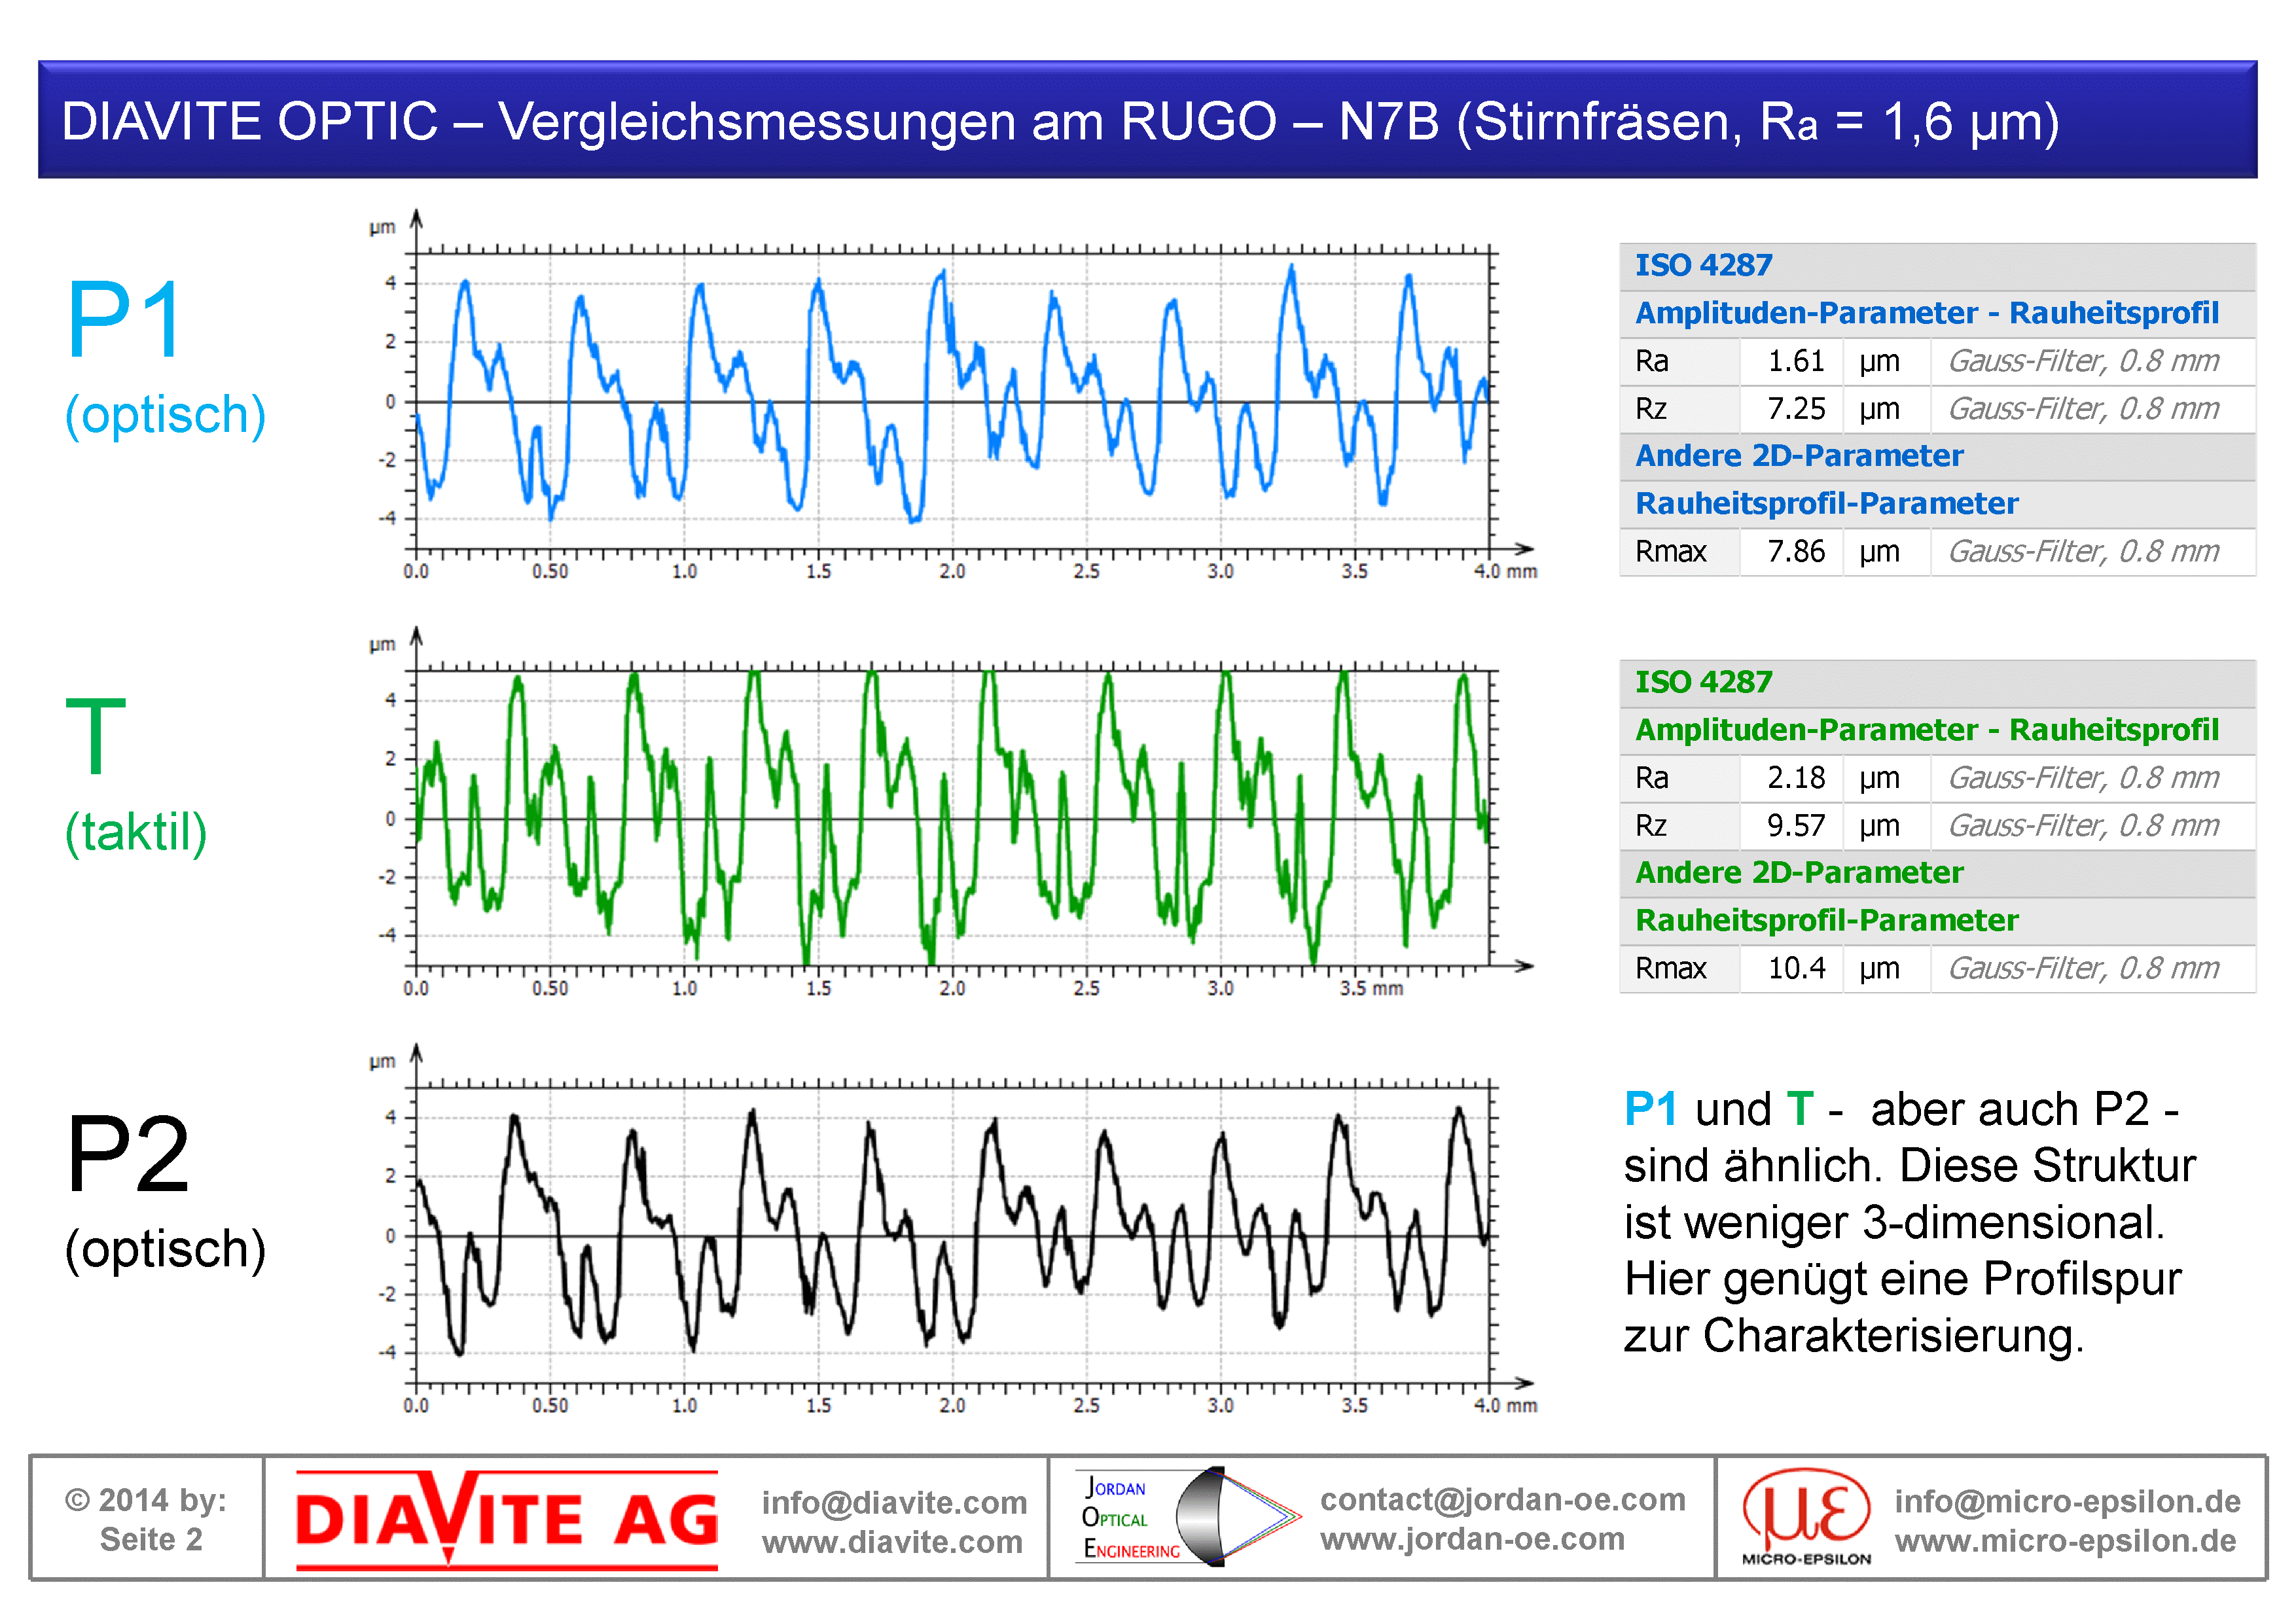
RUGO-N7B (Ra 1,6 µm)
Face-milled surfaces tend to be two-dimensionally rough and therefore require an areal measurement (left image).
In the right image, two optical profiles P1 (blue) and P2 (black) are extracted from the areal measurement. For comparison, a tactile profile T (green) is also shown.

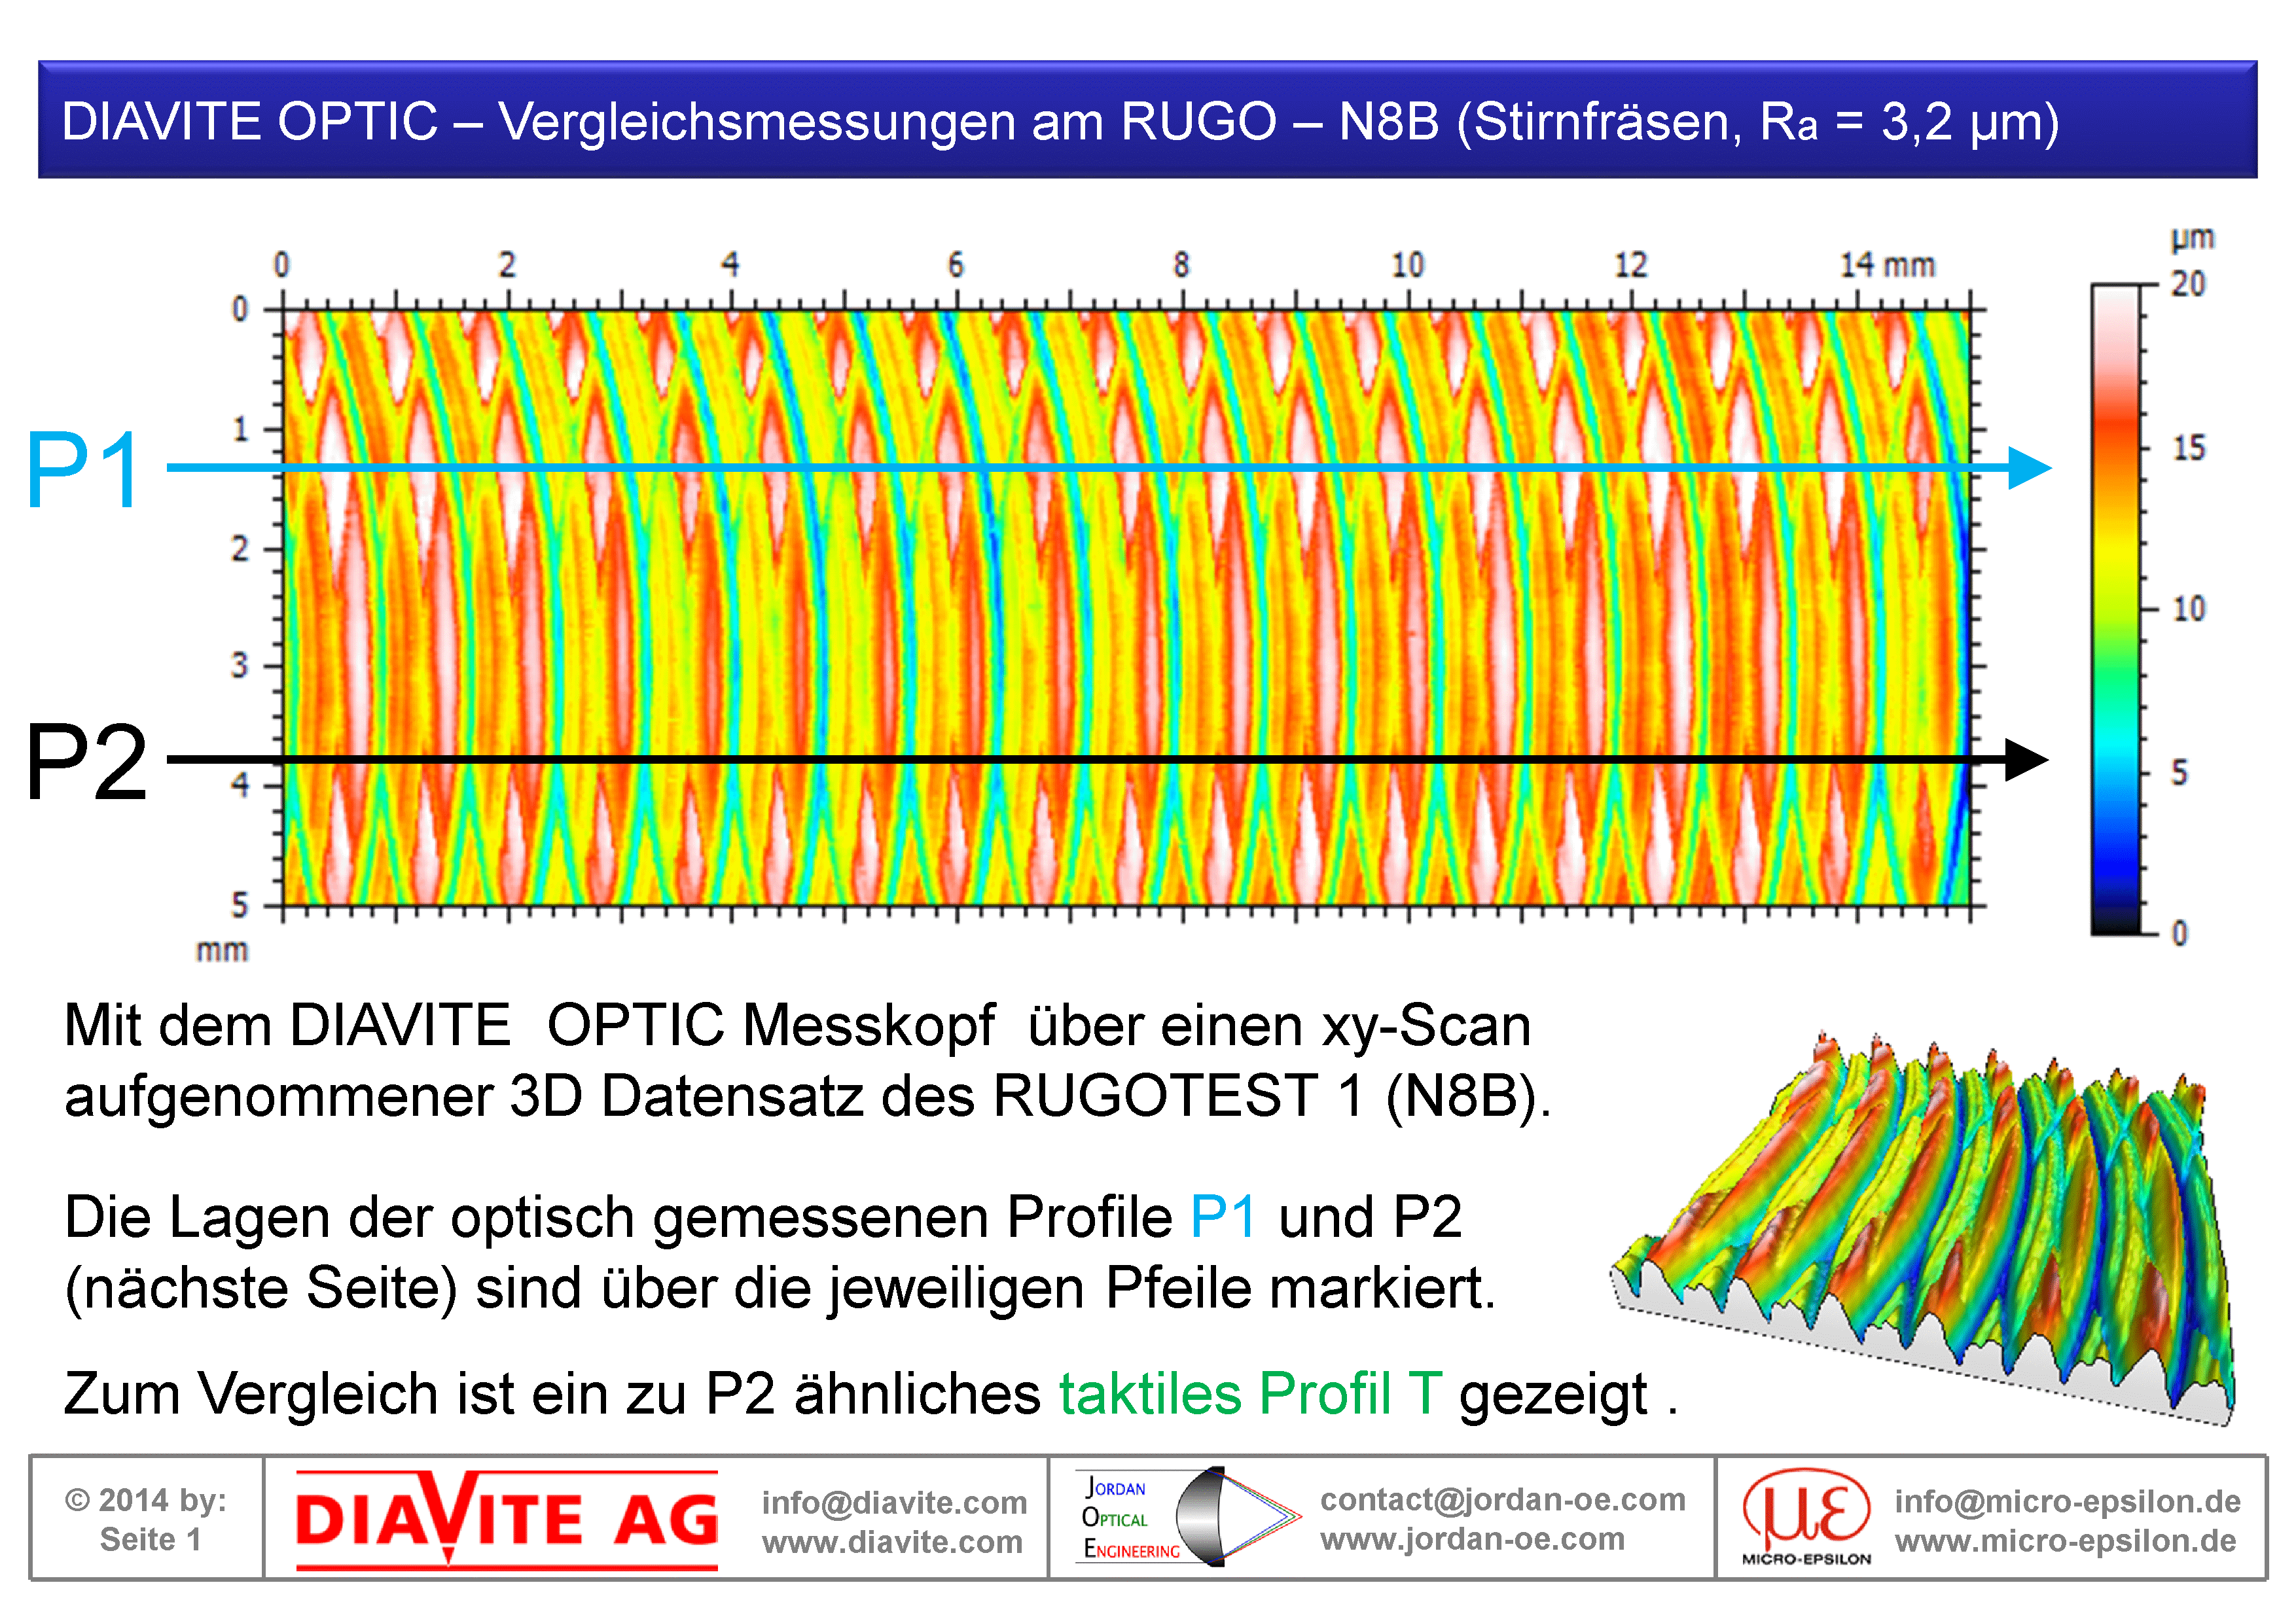
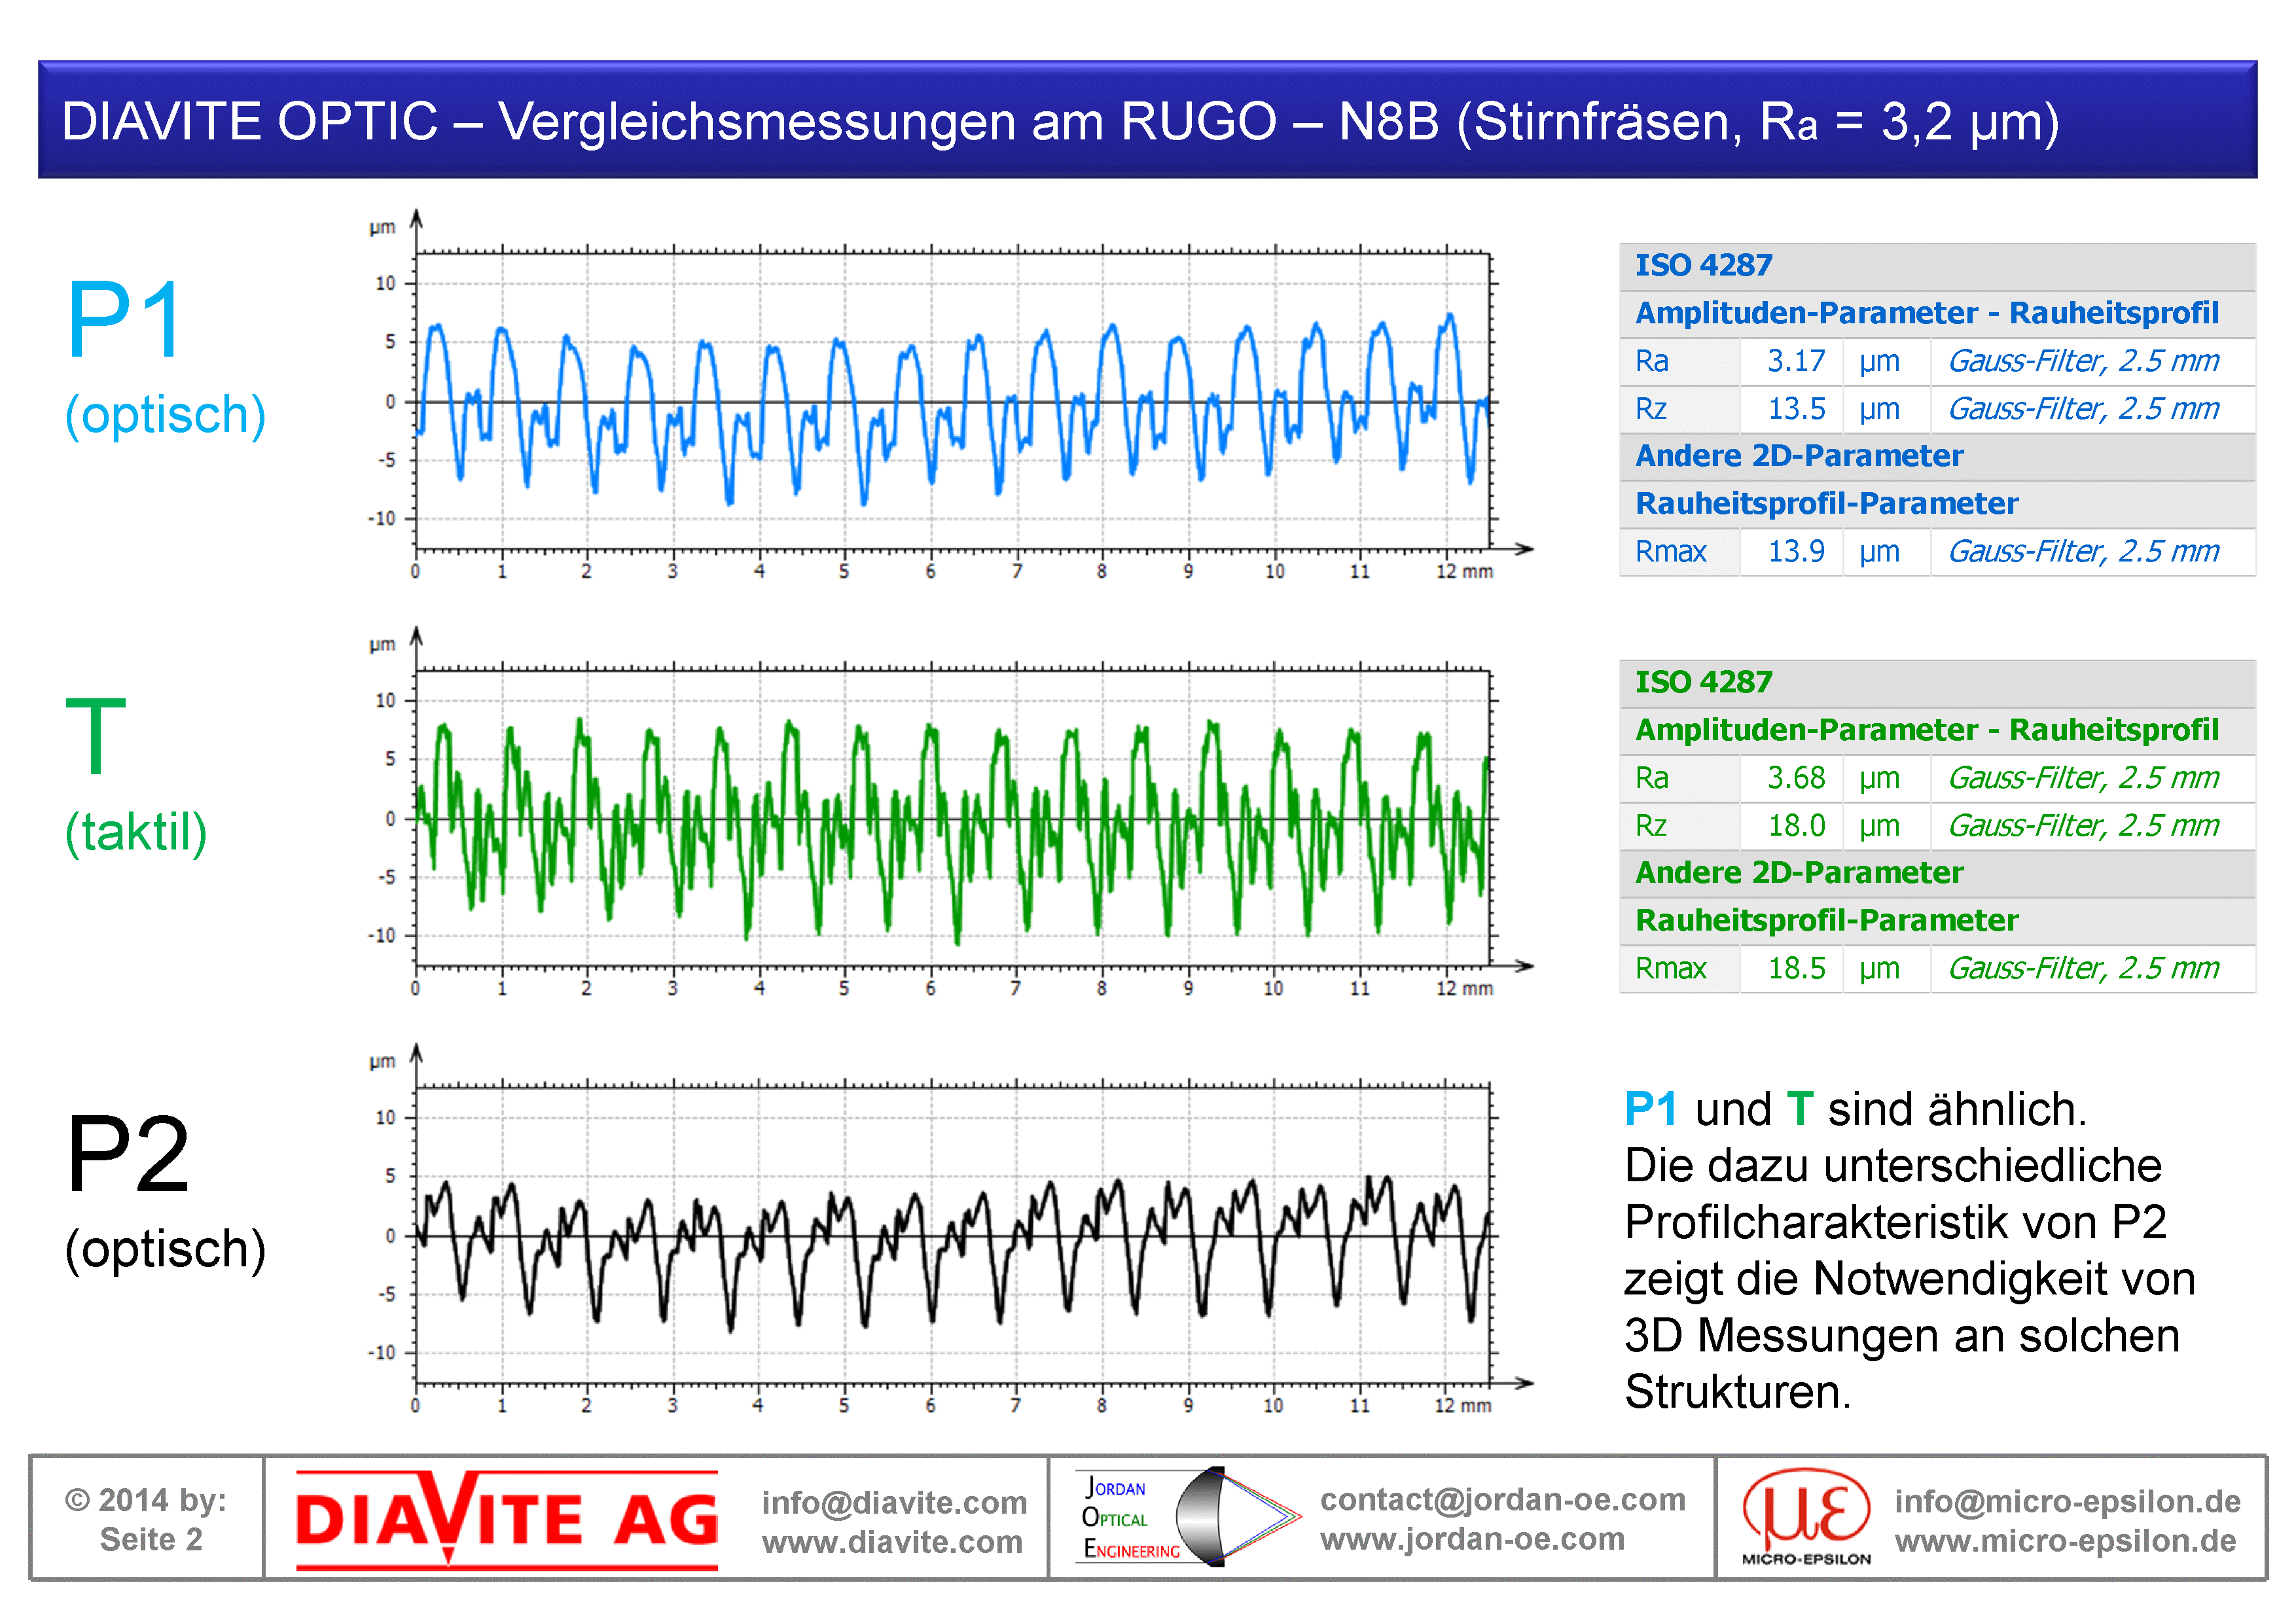
RUGO-N8B (Ra 3,2 µm)
Face-milled surfaces tend to be two-dimensionally rough and therefore require an areal measurement (left image).
In the right image, two optical profiles P1 (blue) and P2 (black) are extracted from the areal measurement. For comparison, a tactile profile T (green) is also shown.
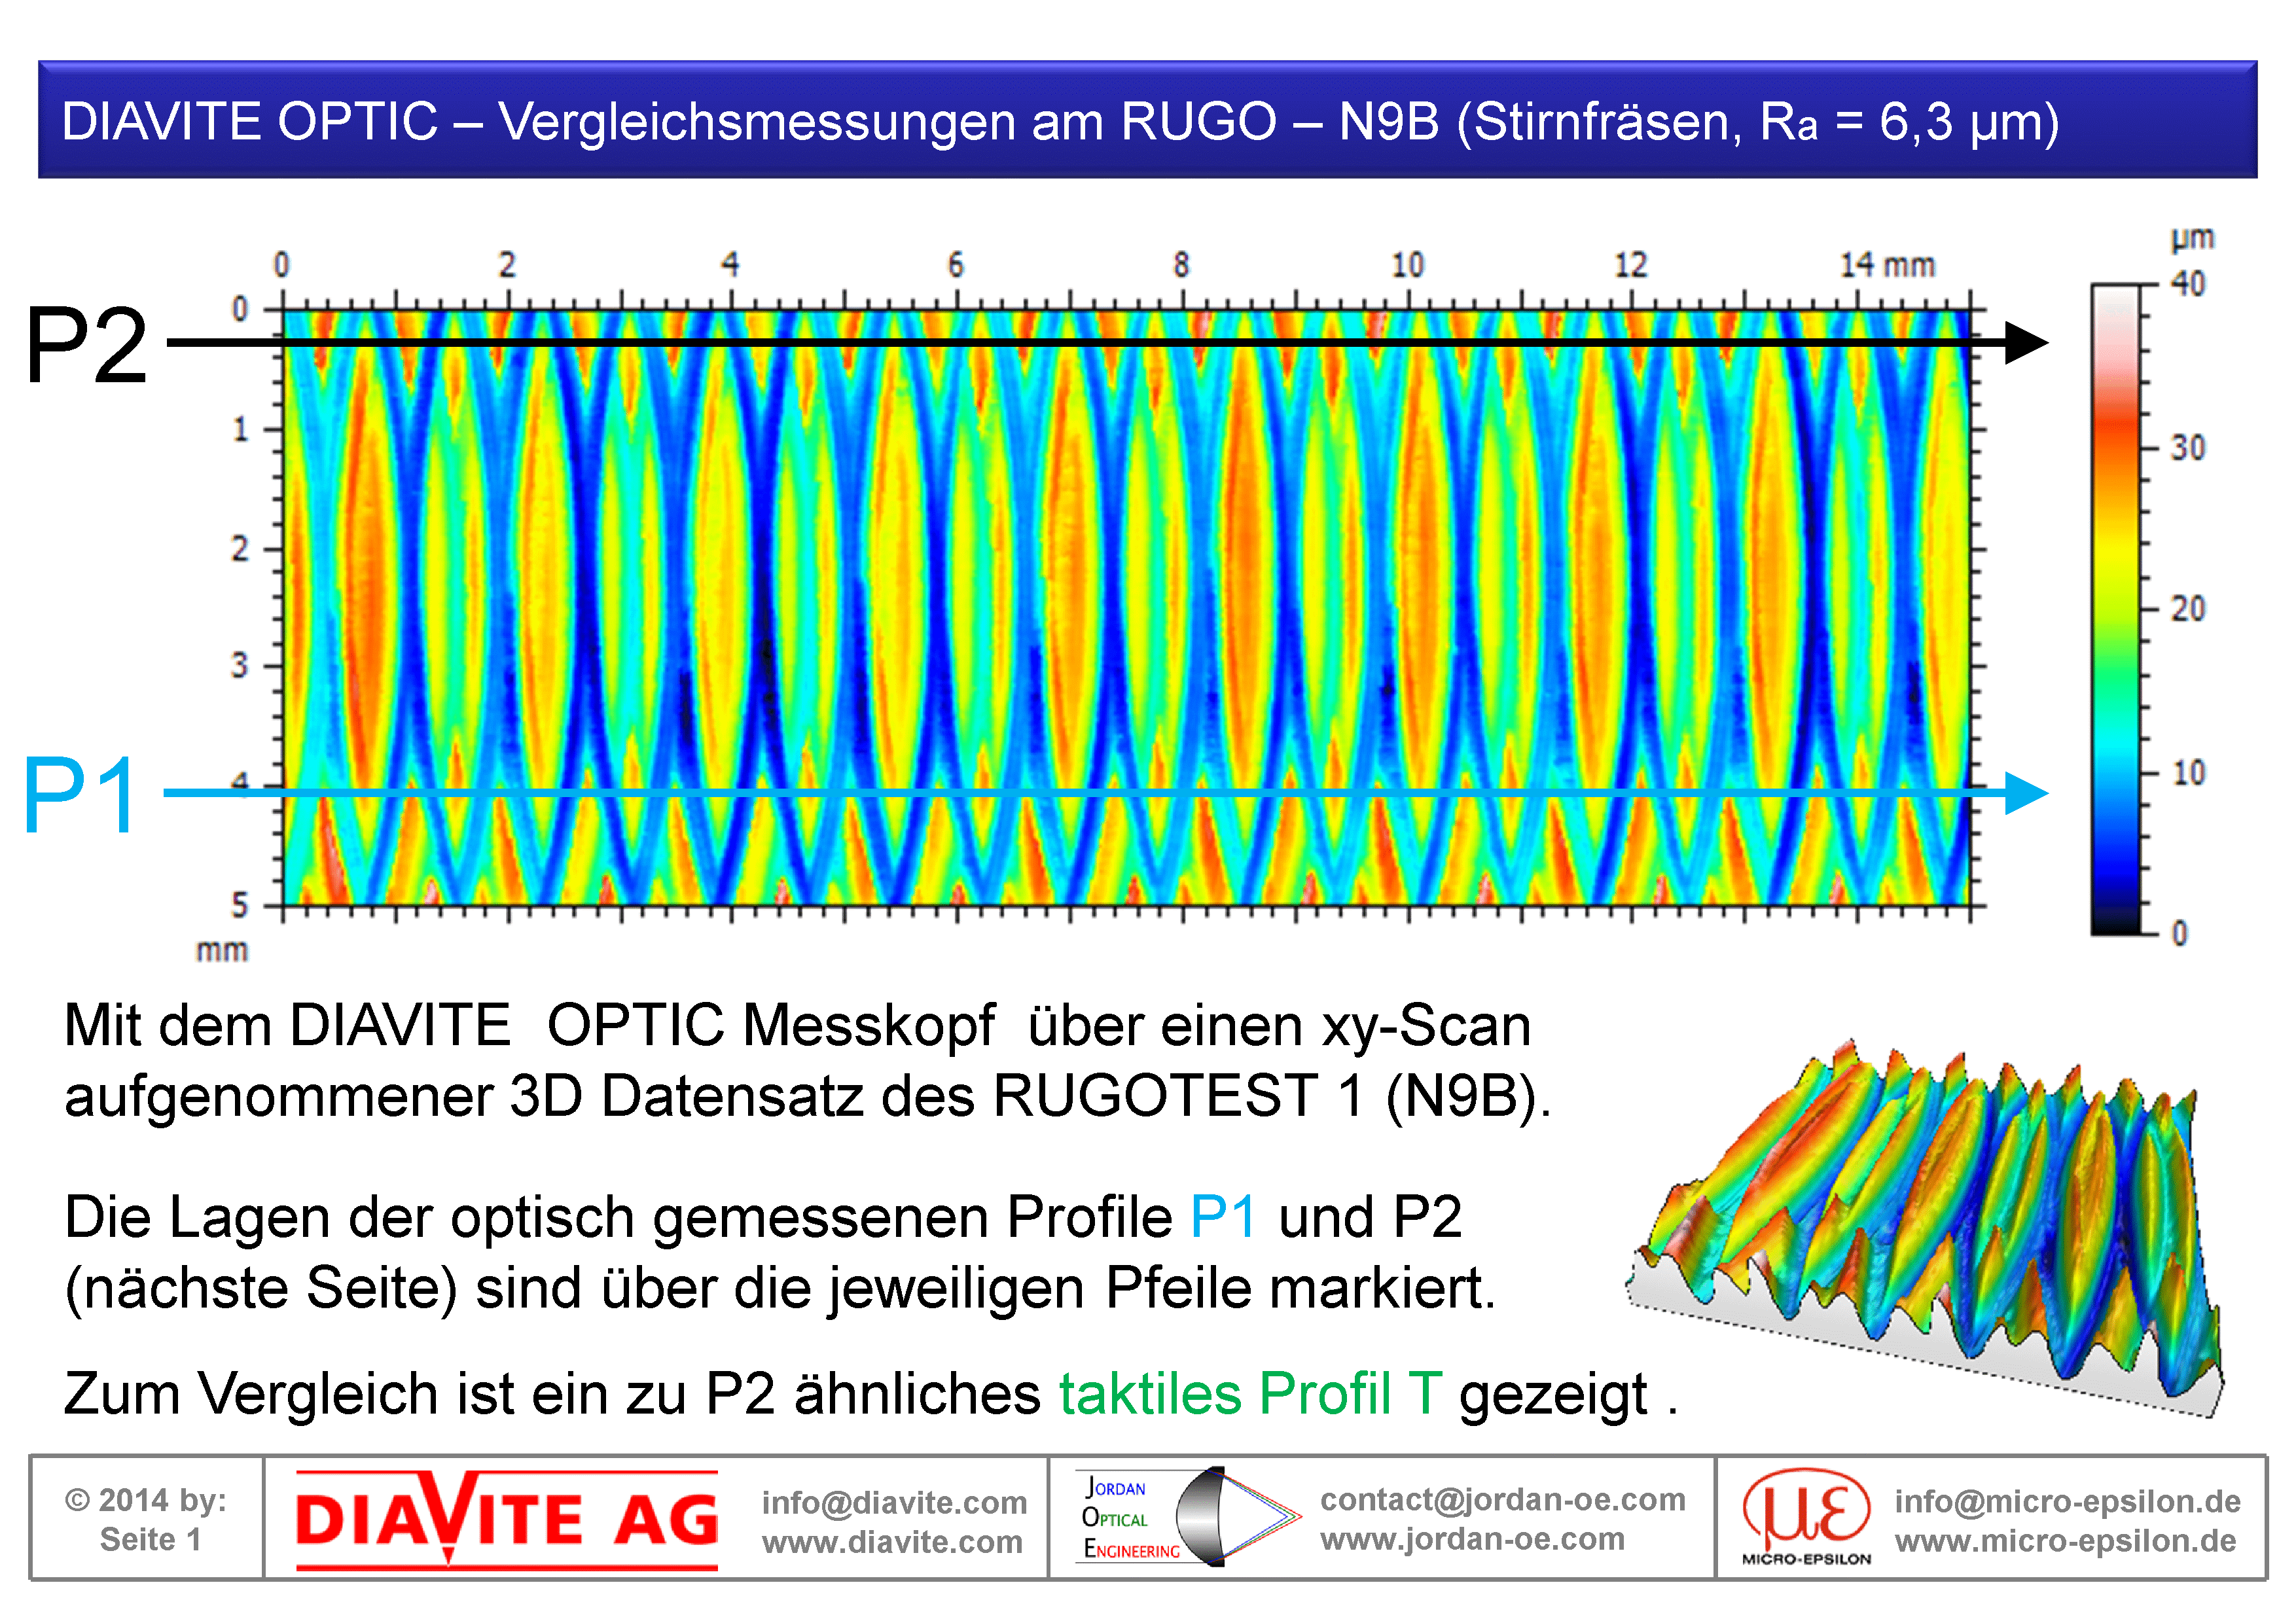
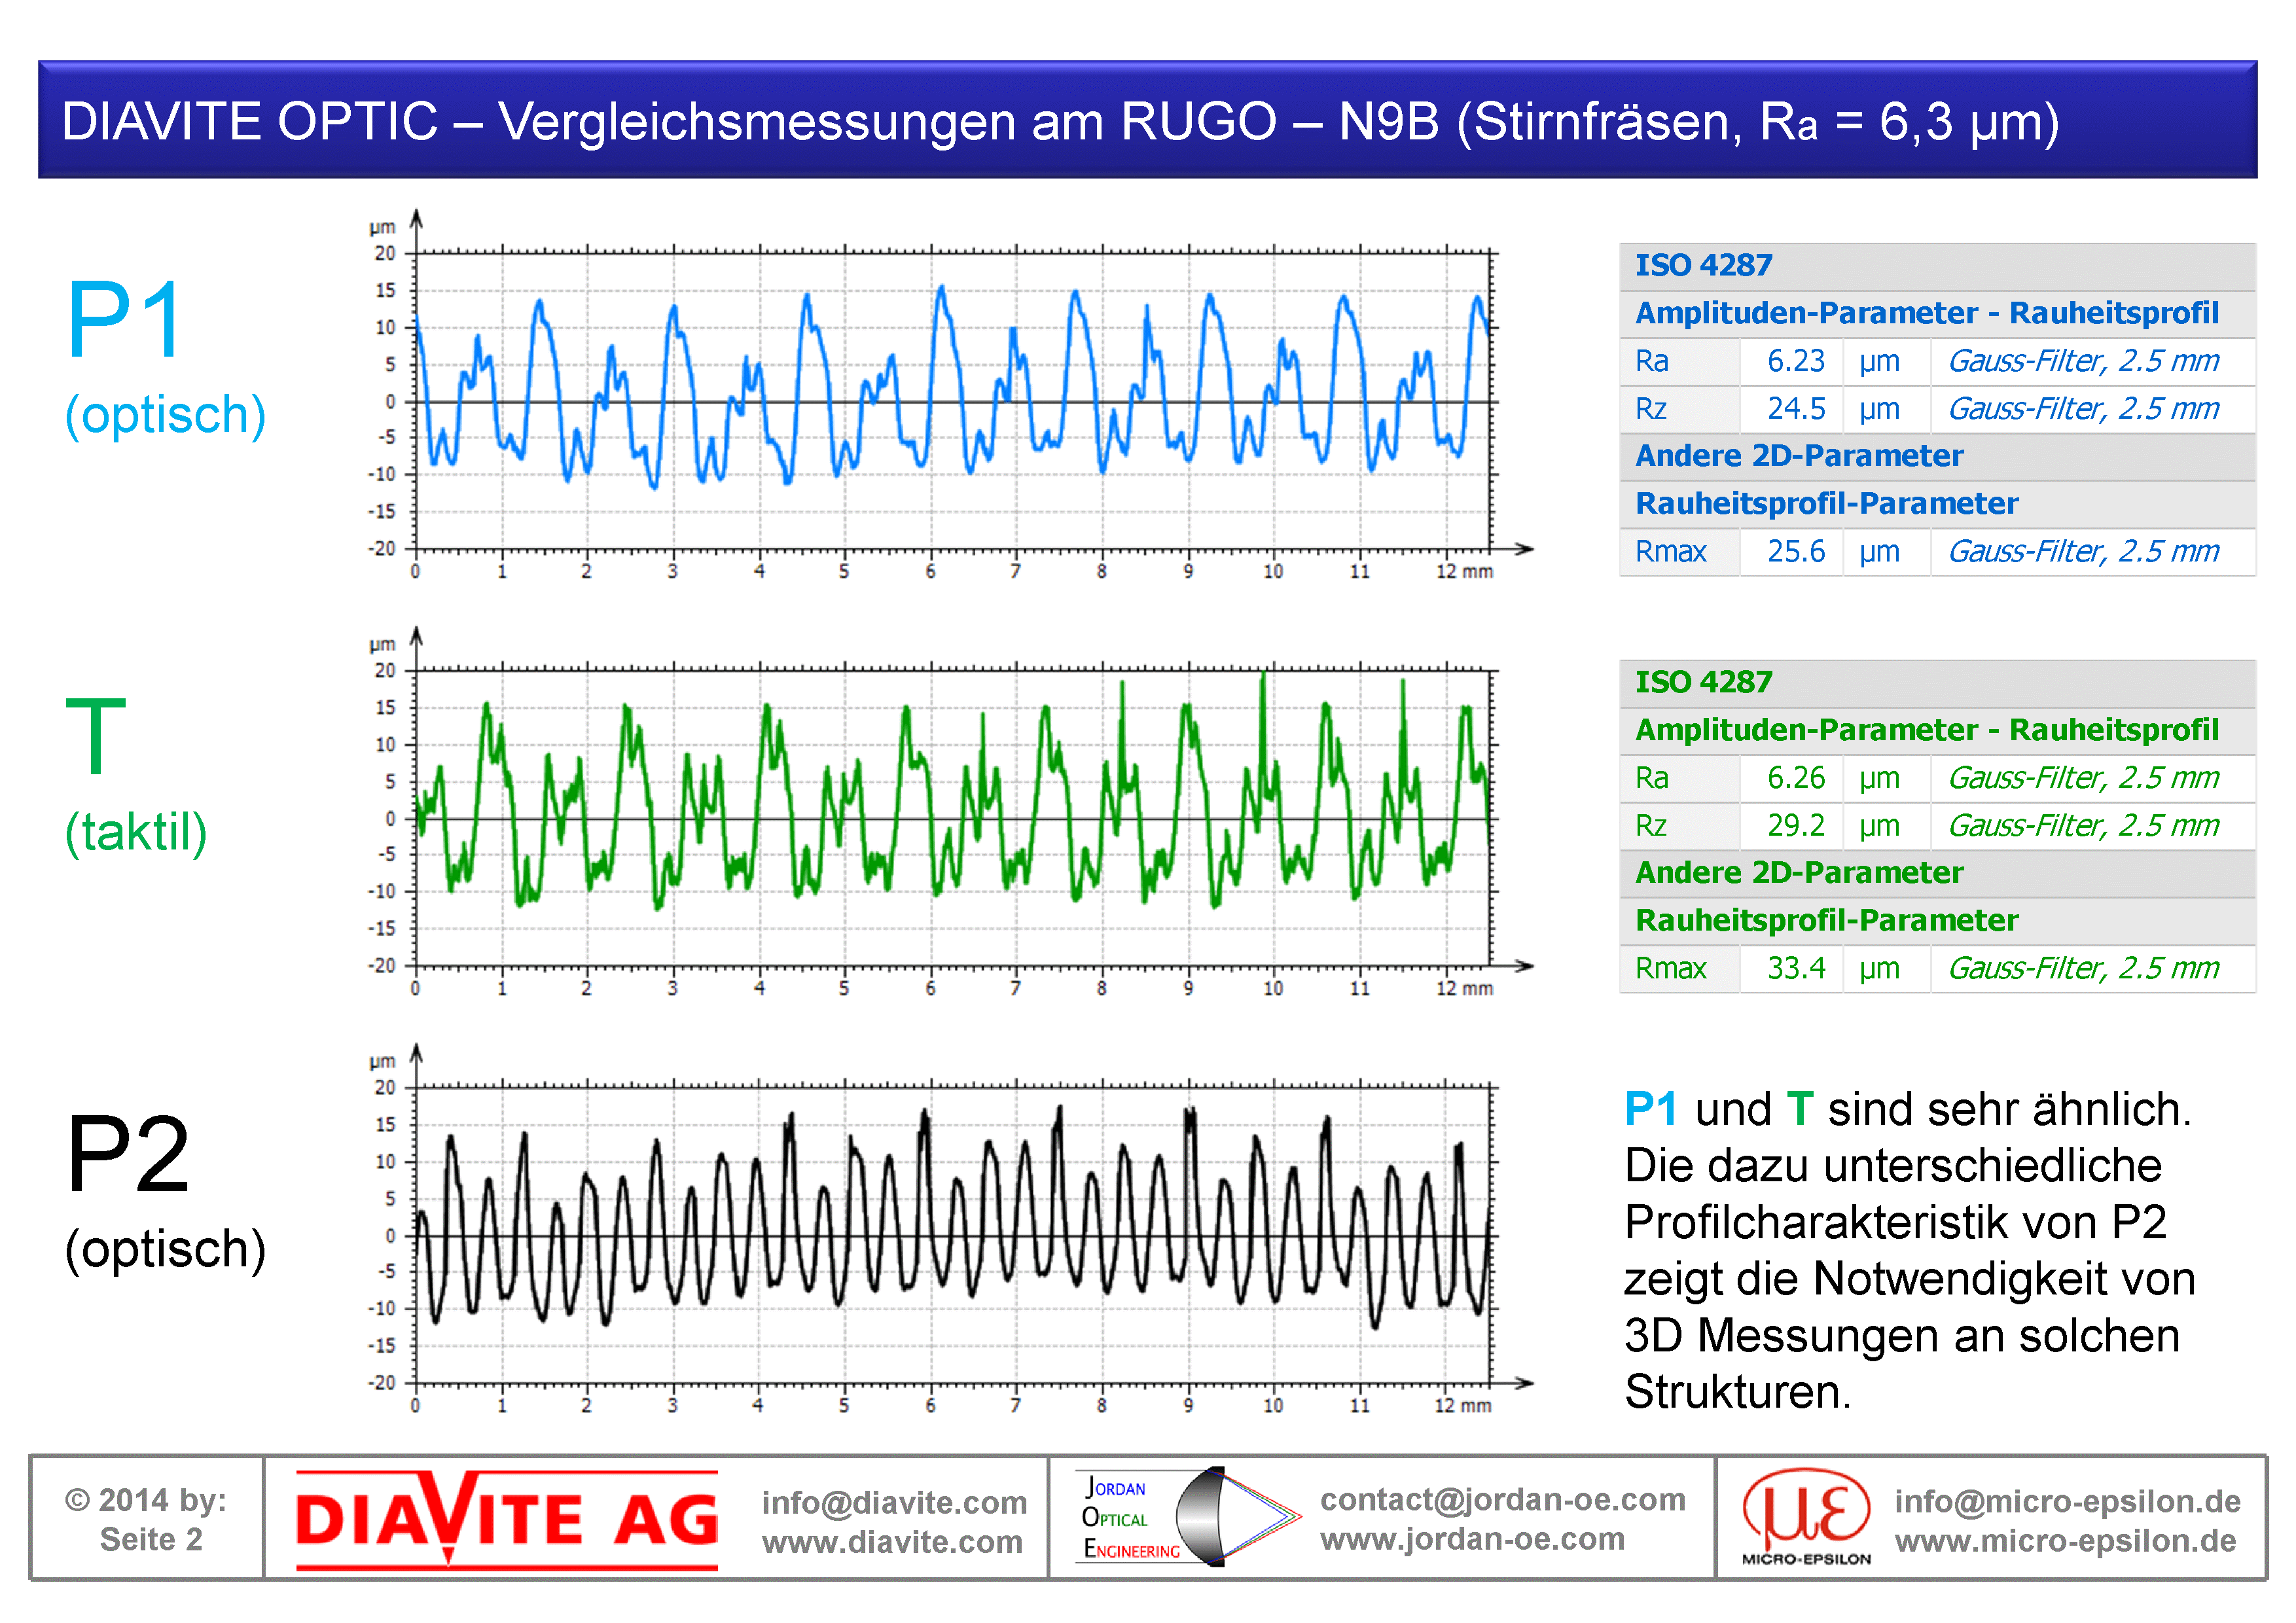
RUGO-N9B (Ra 6,3 µm)
Face-milled surfaces tend to be two-dimensionally rough and therefore require an areal measurement (left image).
In the right image, two optical profiles P1 (blue) and P2 (black) are extracted from the areal measurement. For comparison, a tactile profile T (green) is also shown.
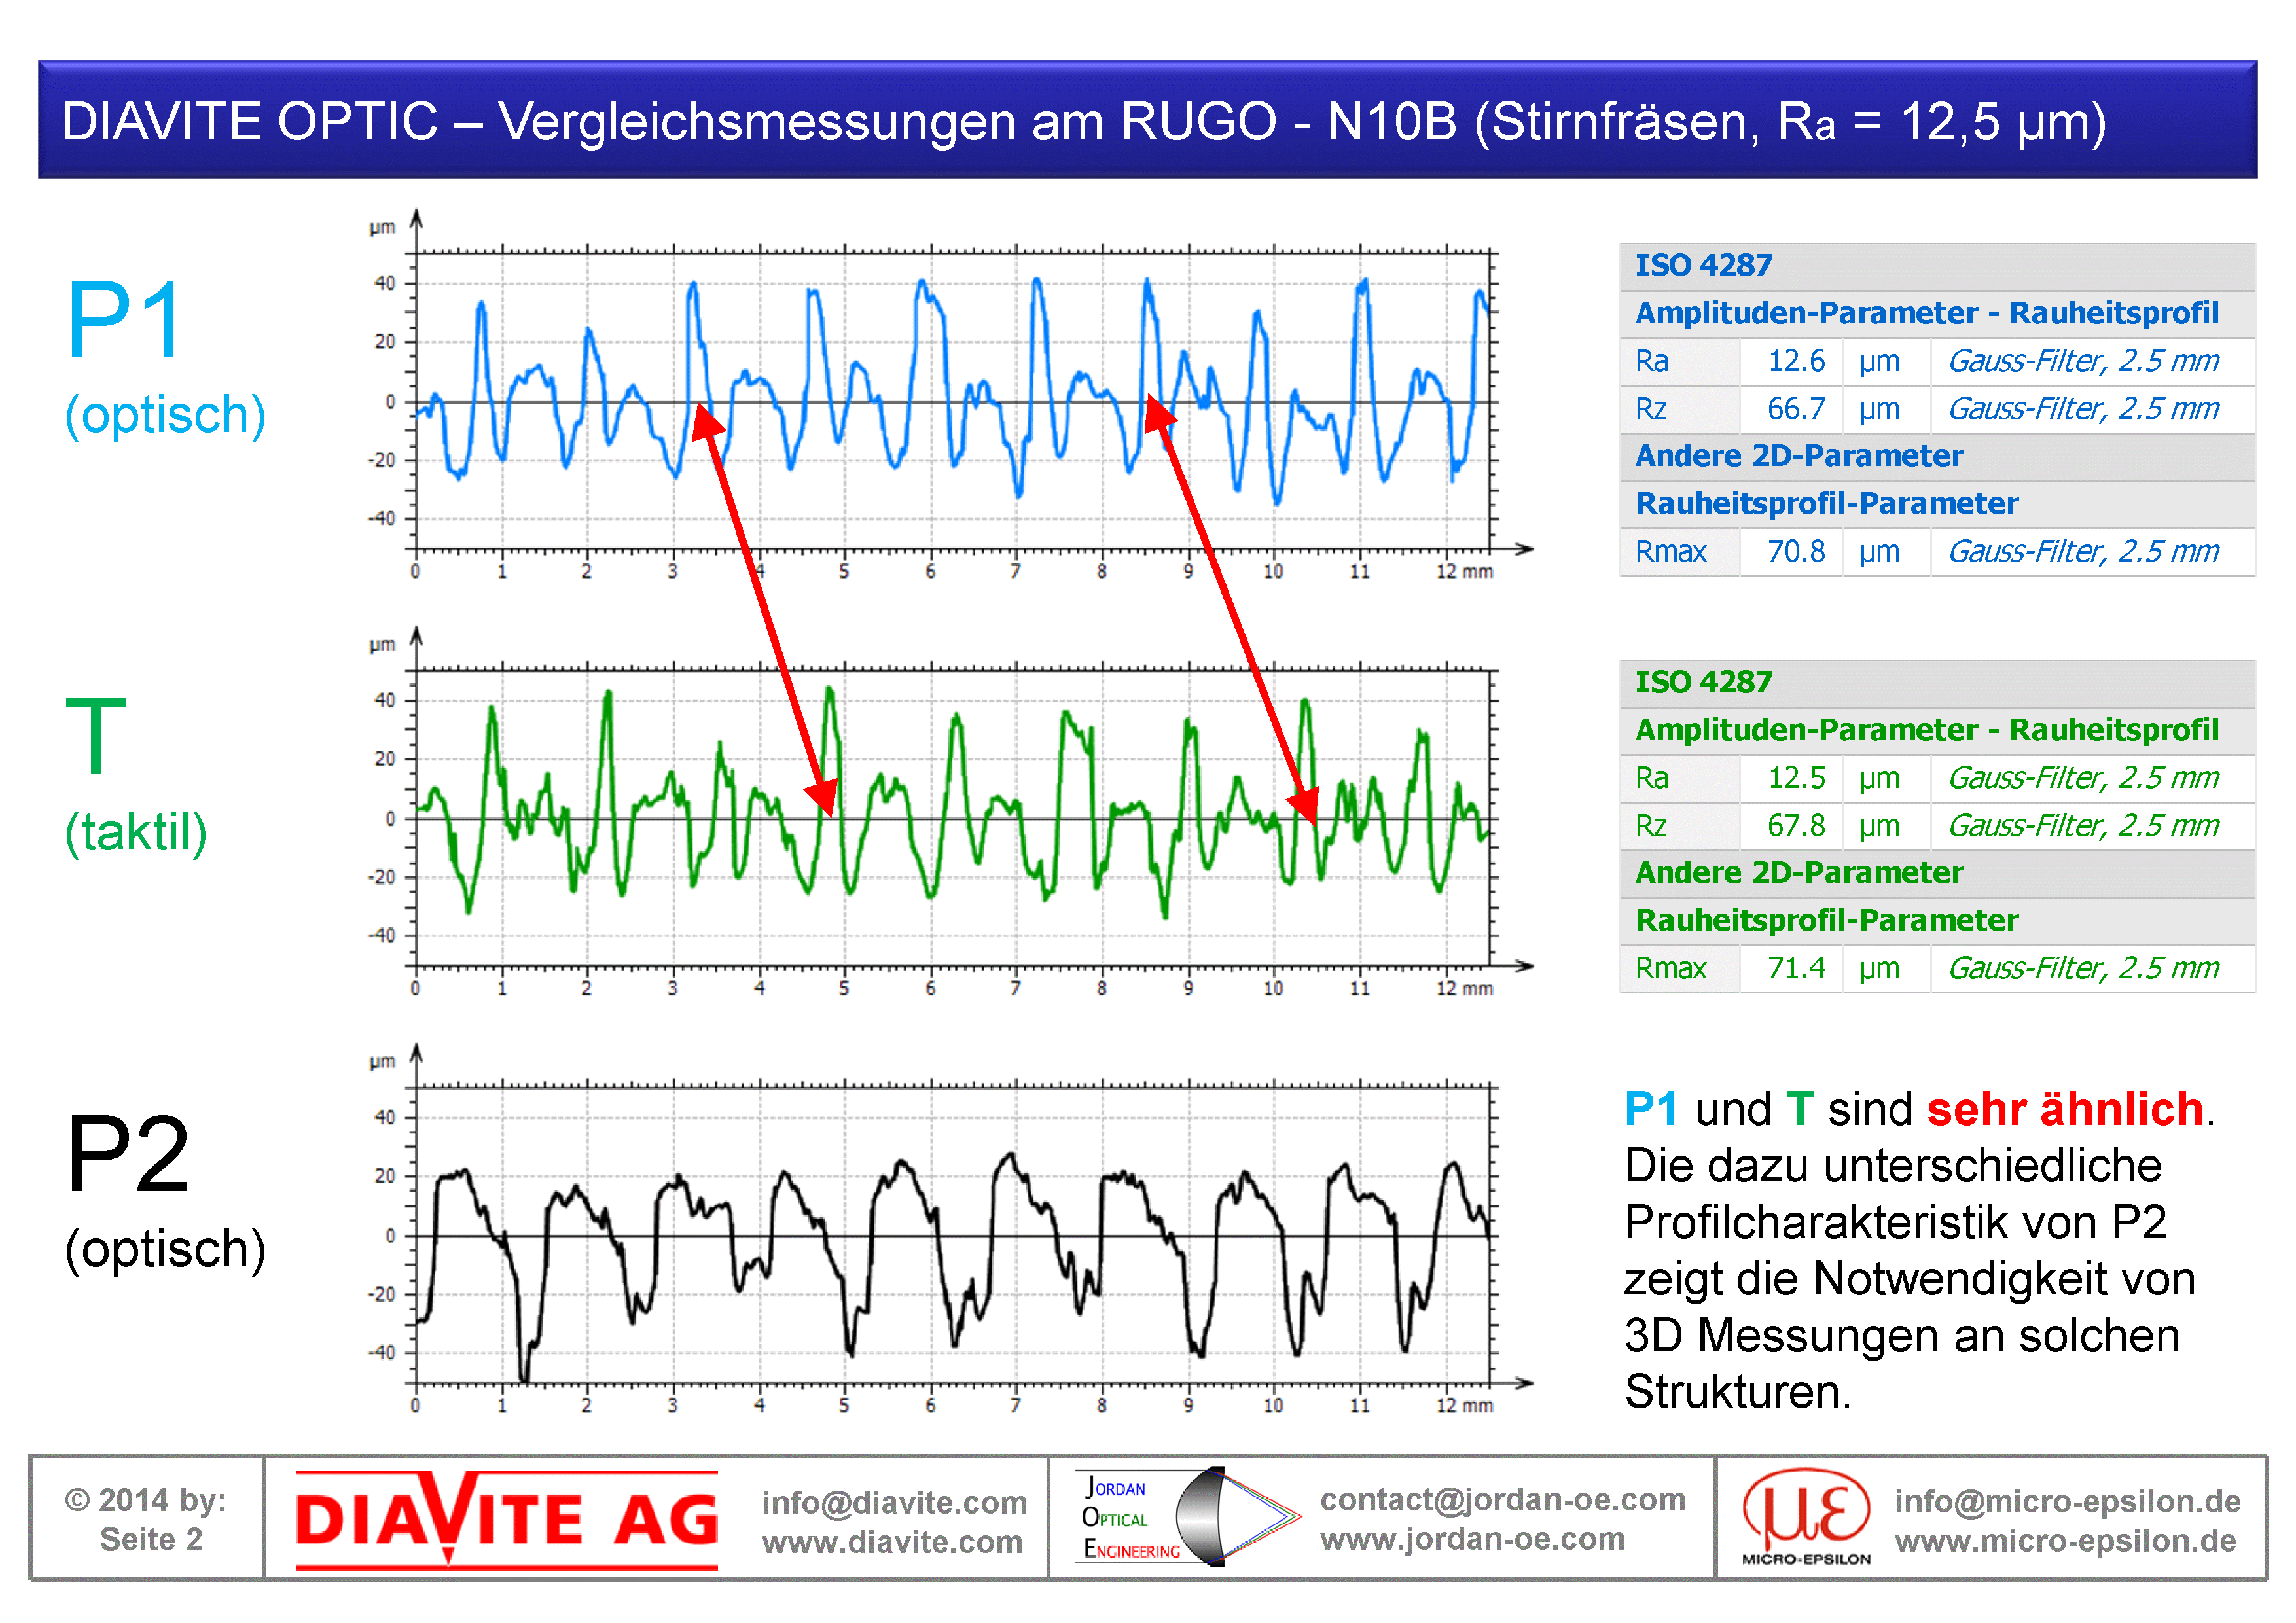
RUGO-N10B (Ra 12,5 µm)
Face-milled surfaces tend to be two-dimensionally rough and therefore require an areal measurement (left image).
In the right image, two optical profiles P1 (blue) and P2 (black) are extracted from the areal measurement. For comparison, a tactile profile T (green) is also shown.

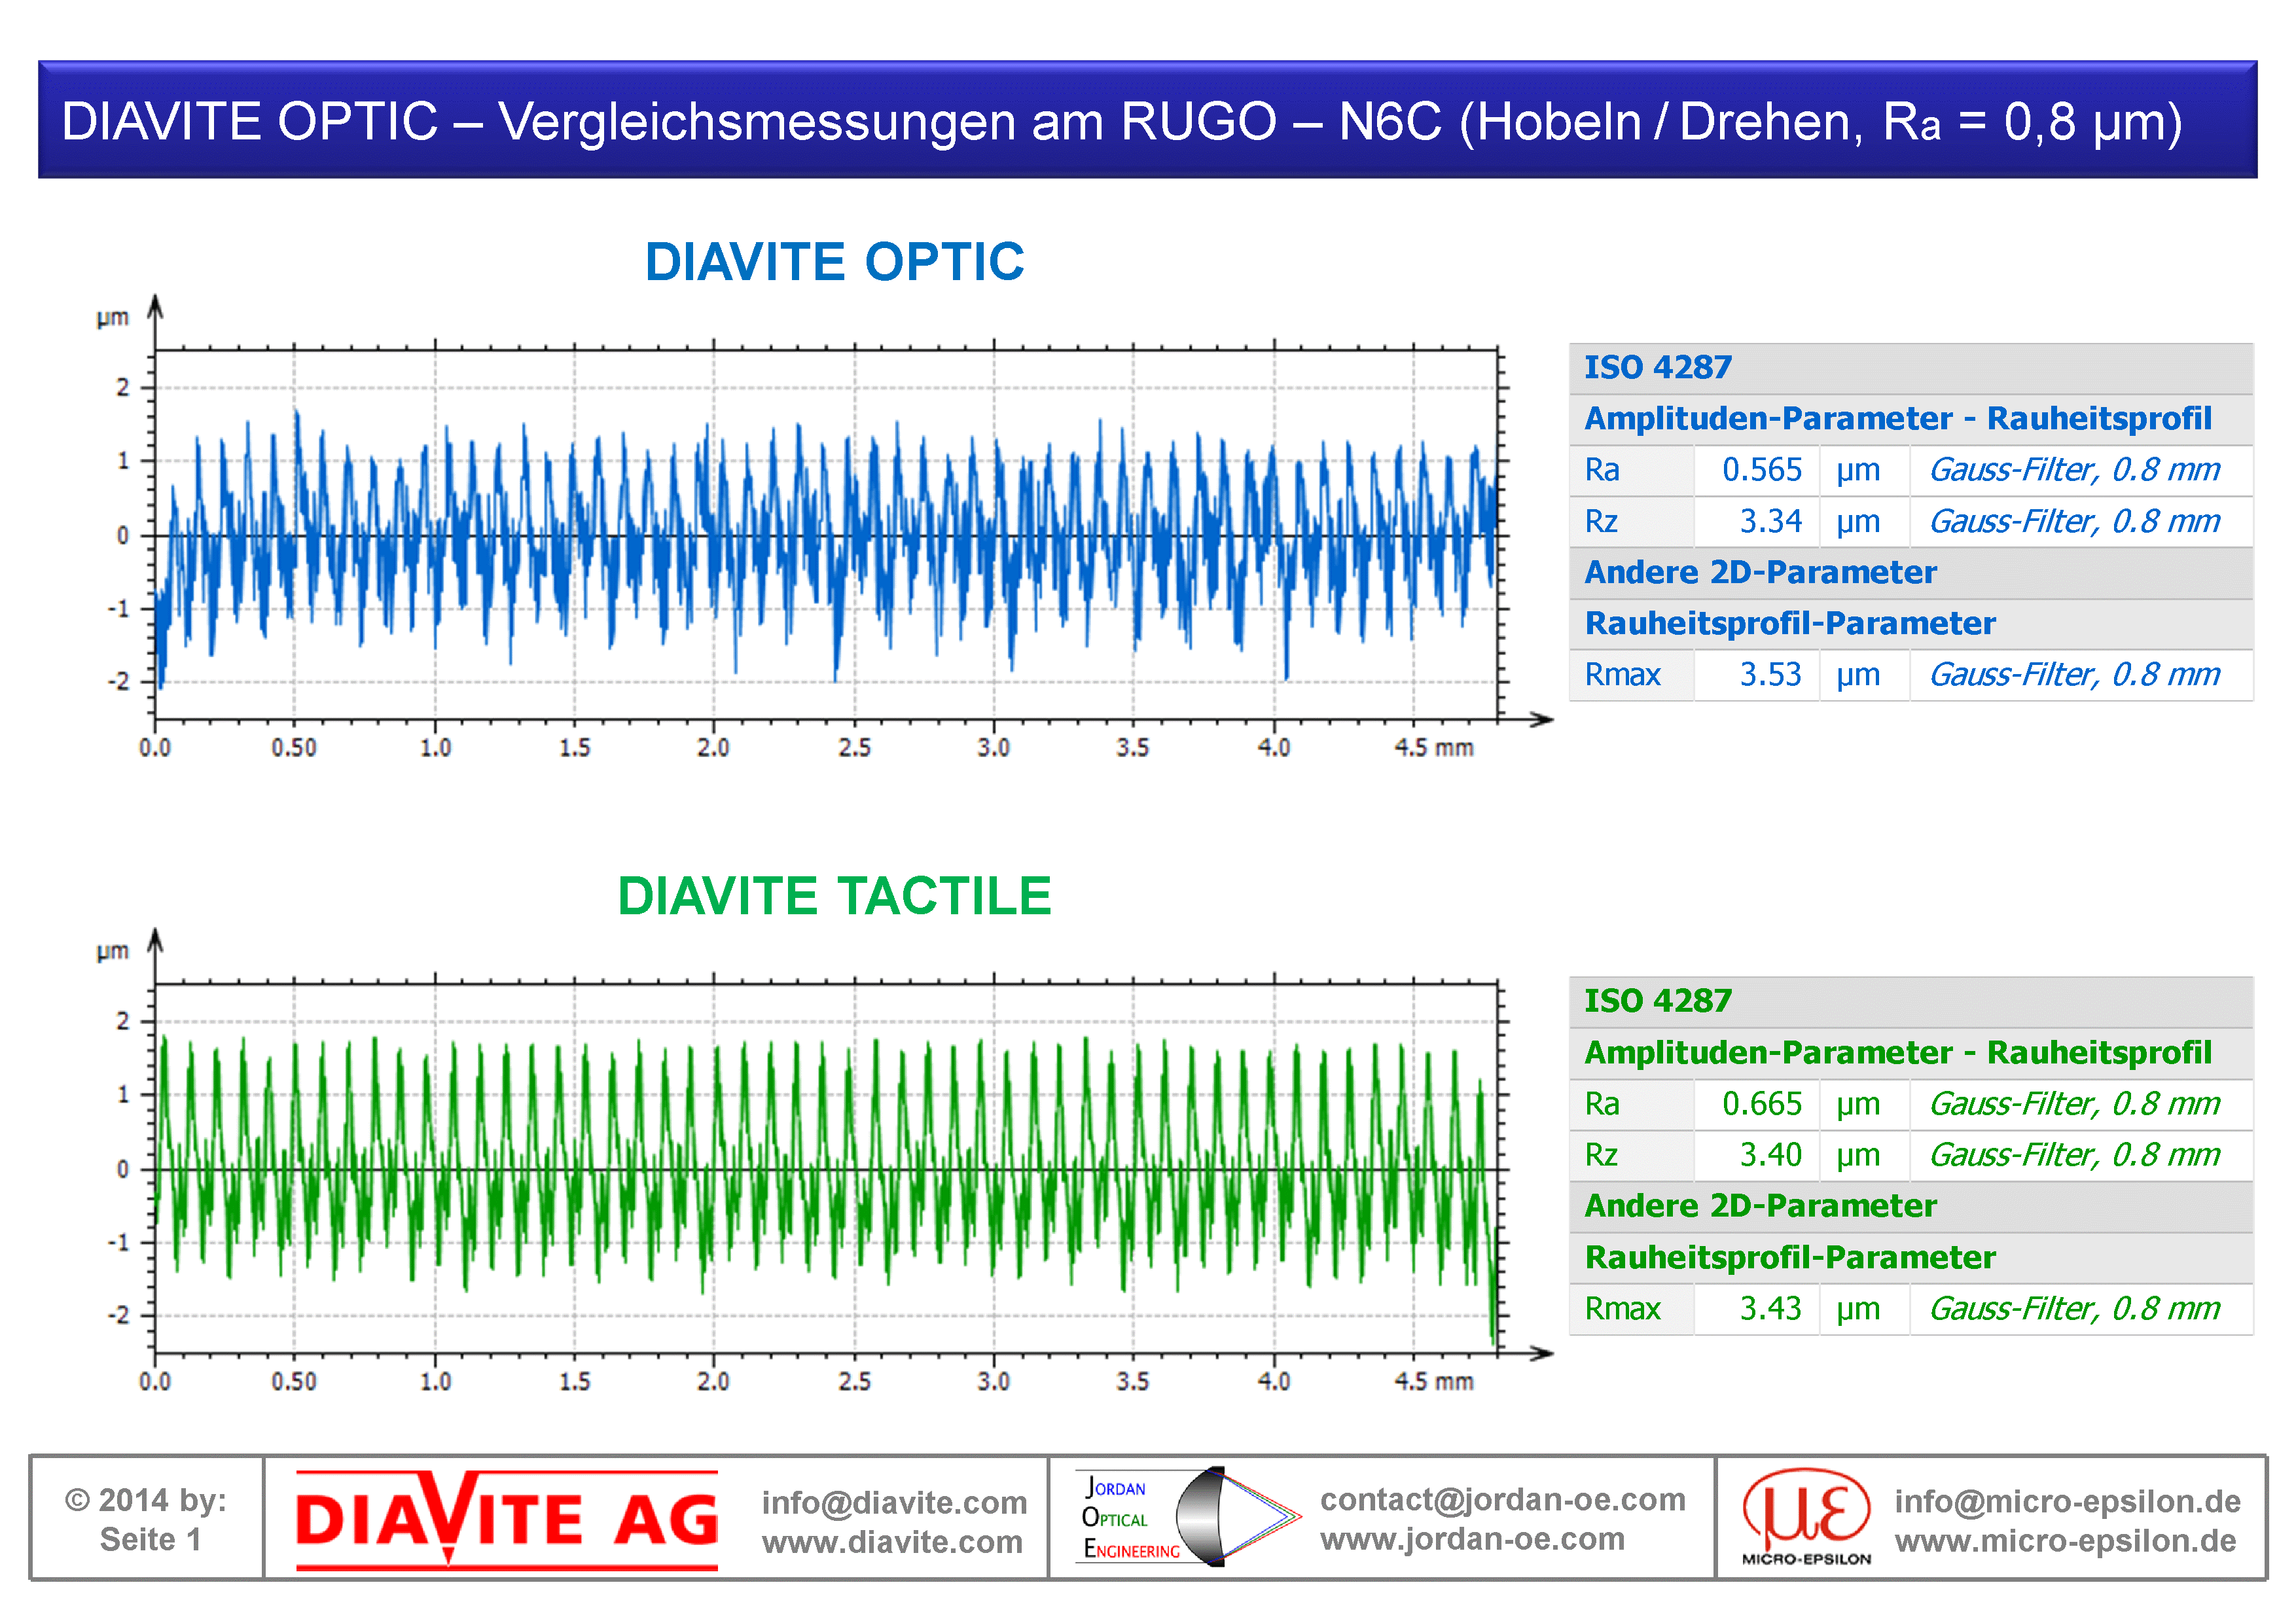
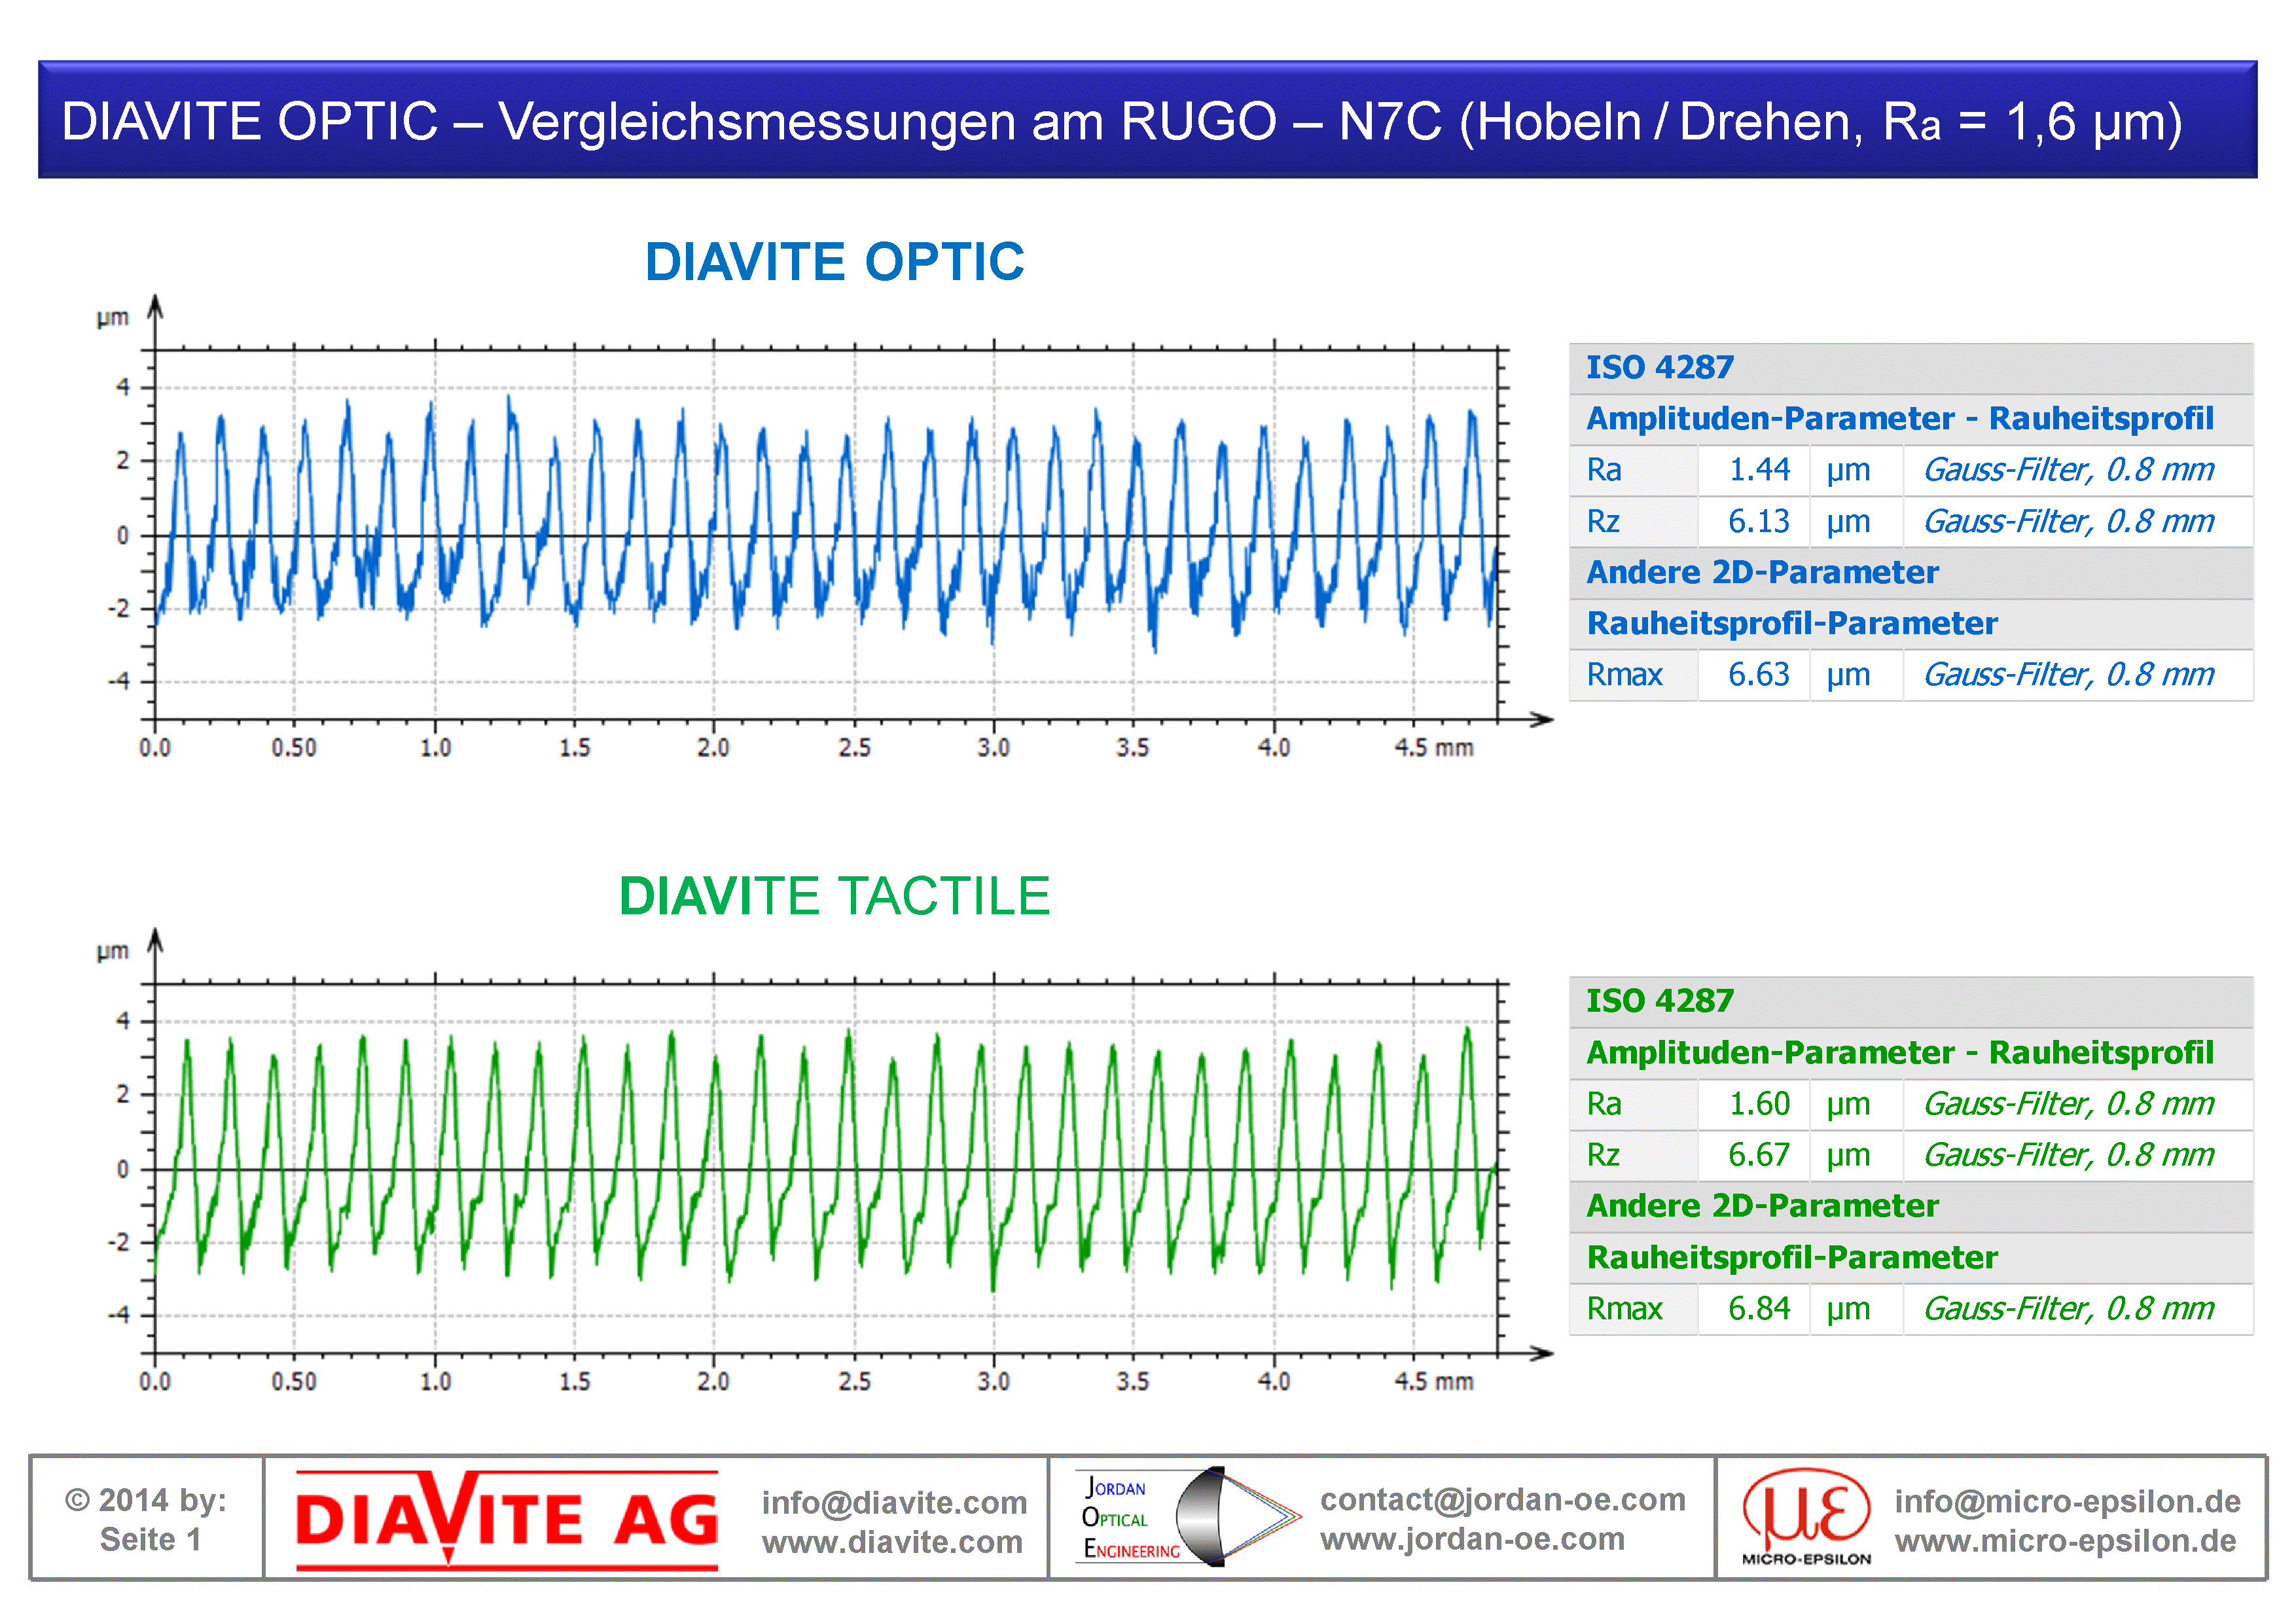
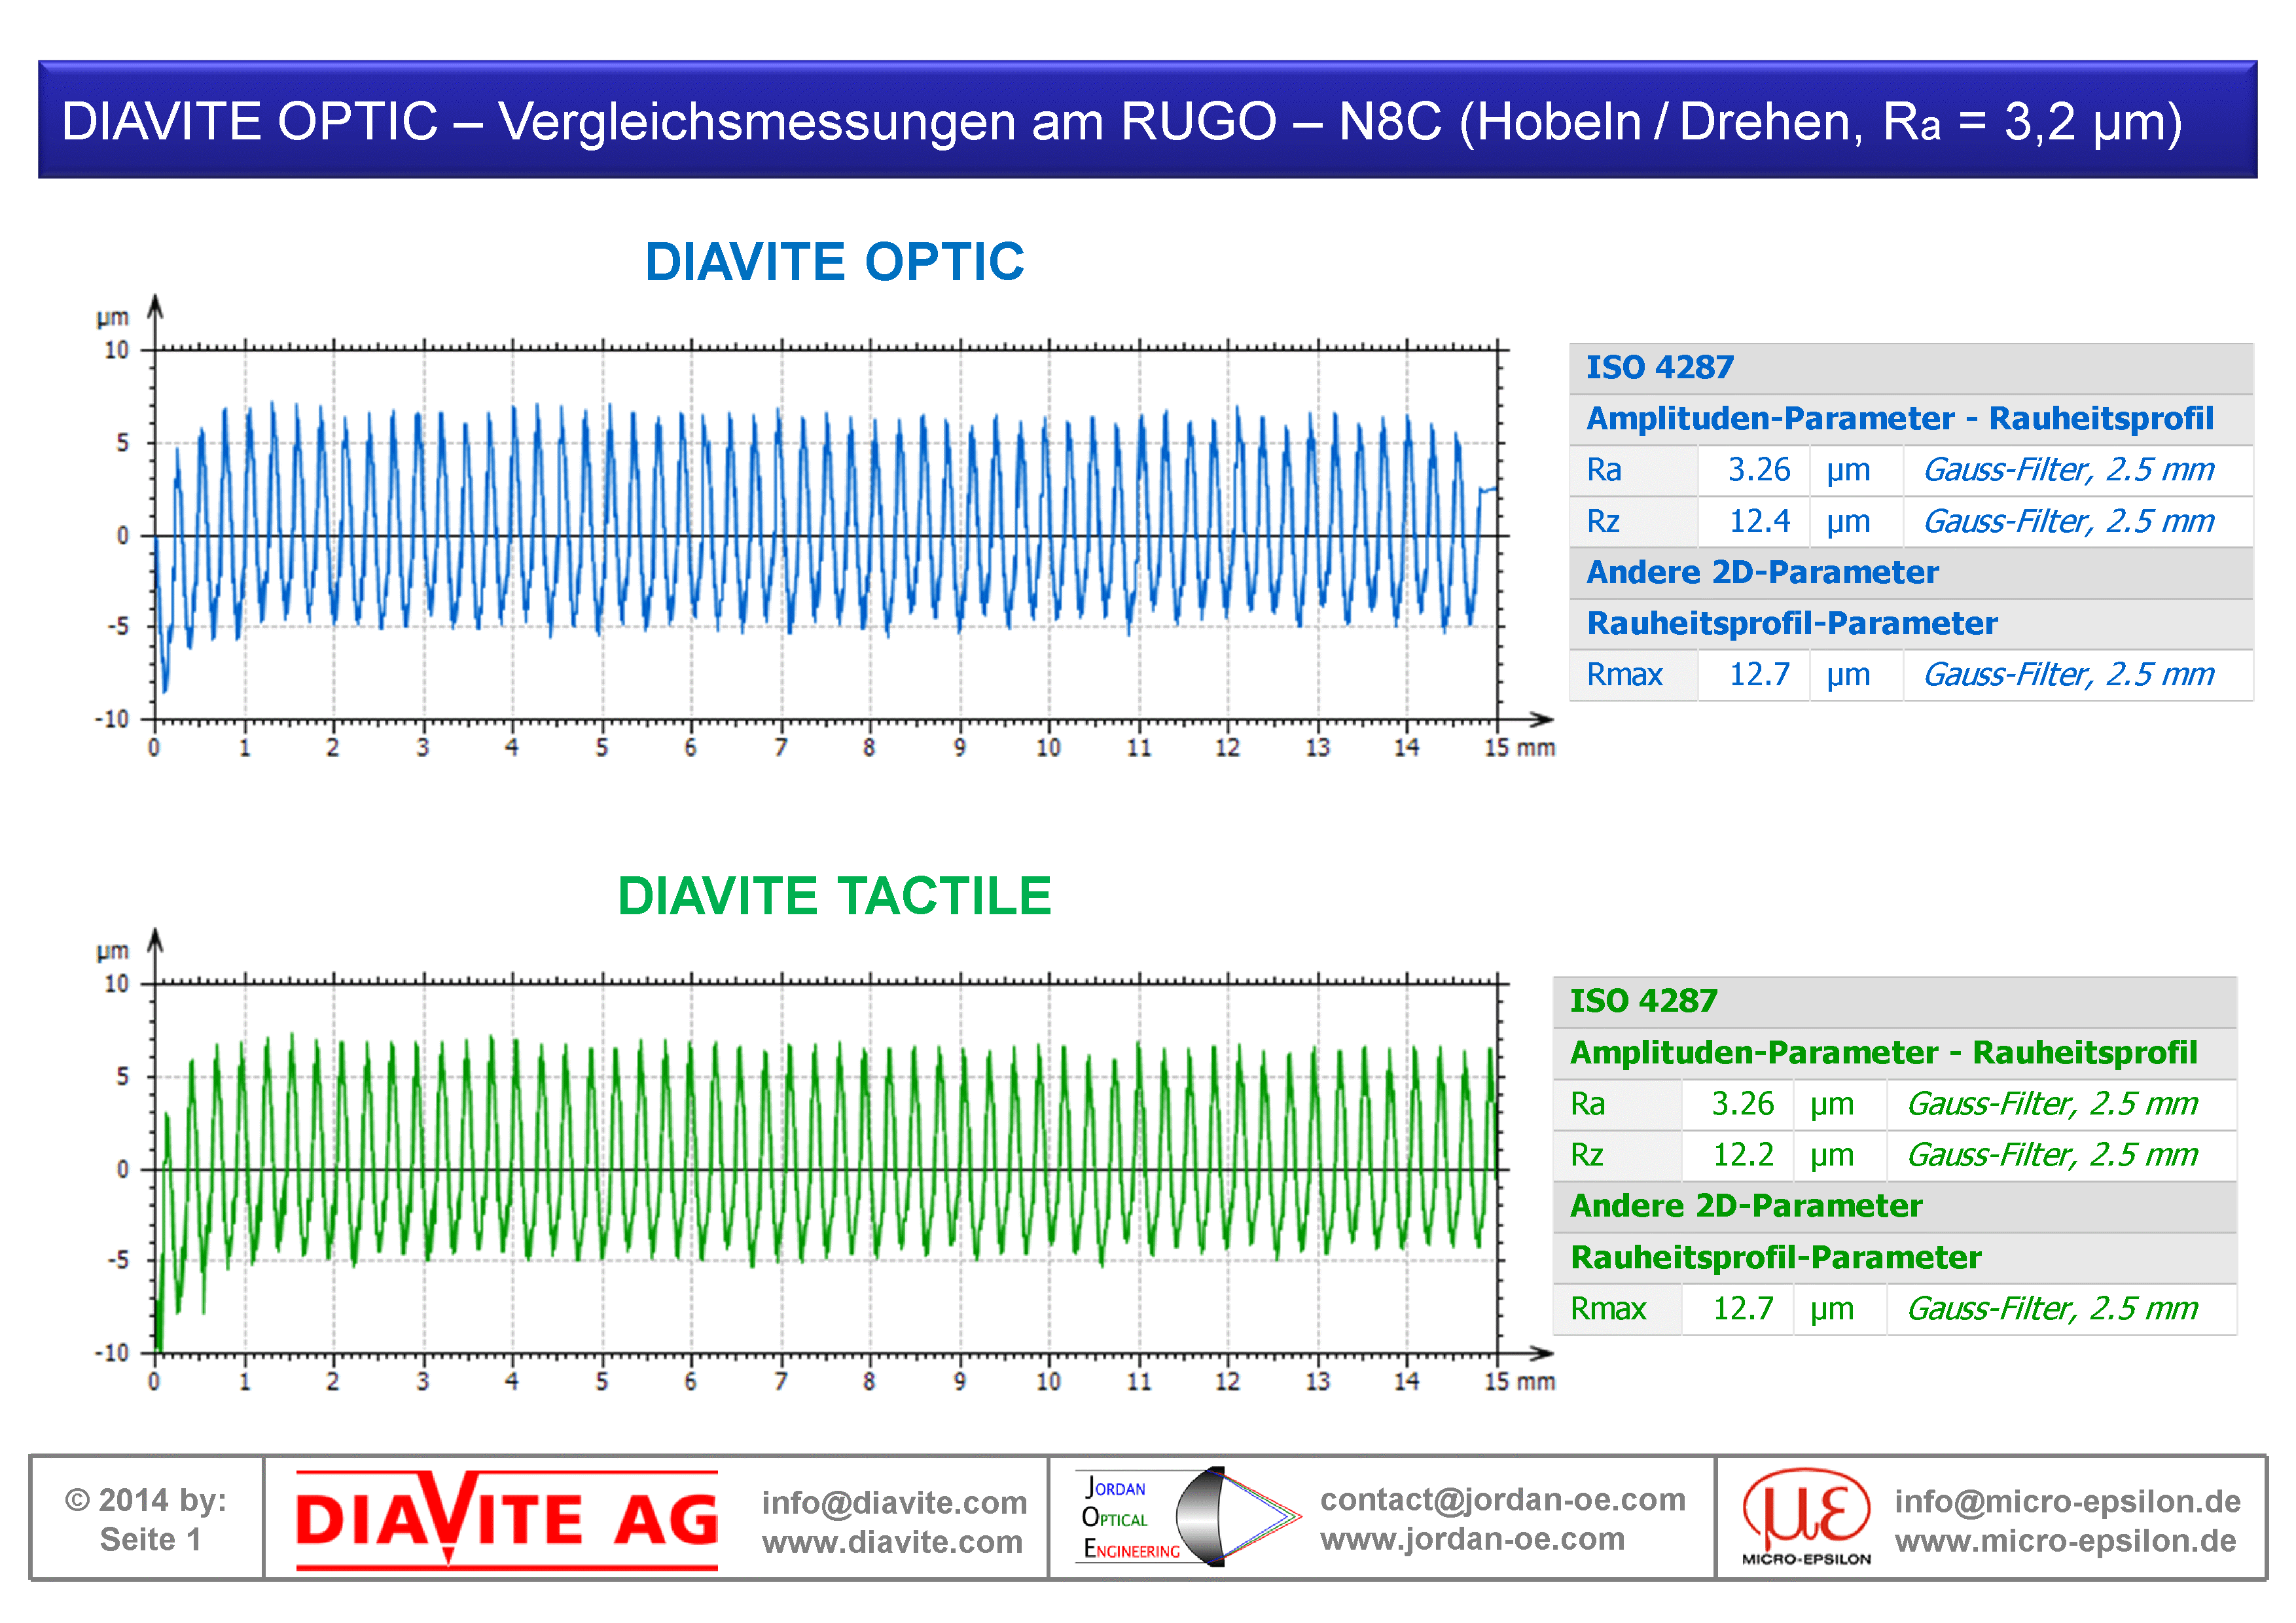
RUGO-N6C (Ra 0,8 µm), RUGO-N7C (Ra 1,6 µm), RUGO-N8C (Ra 3,2 µm)
Planed / turned surfaces are primarily one-dimensional rough and can therefore be compared well via profile sections.
Comparison of optical measurements (blue profiles) and tactile comparison measurements (green profiles) on three planed / turned surfaces.
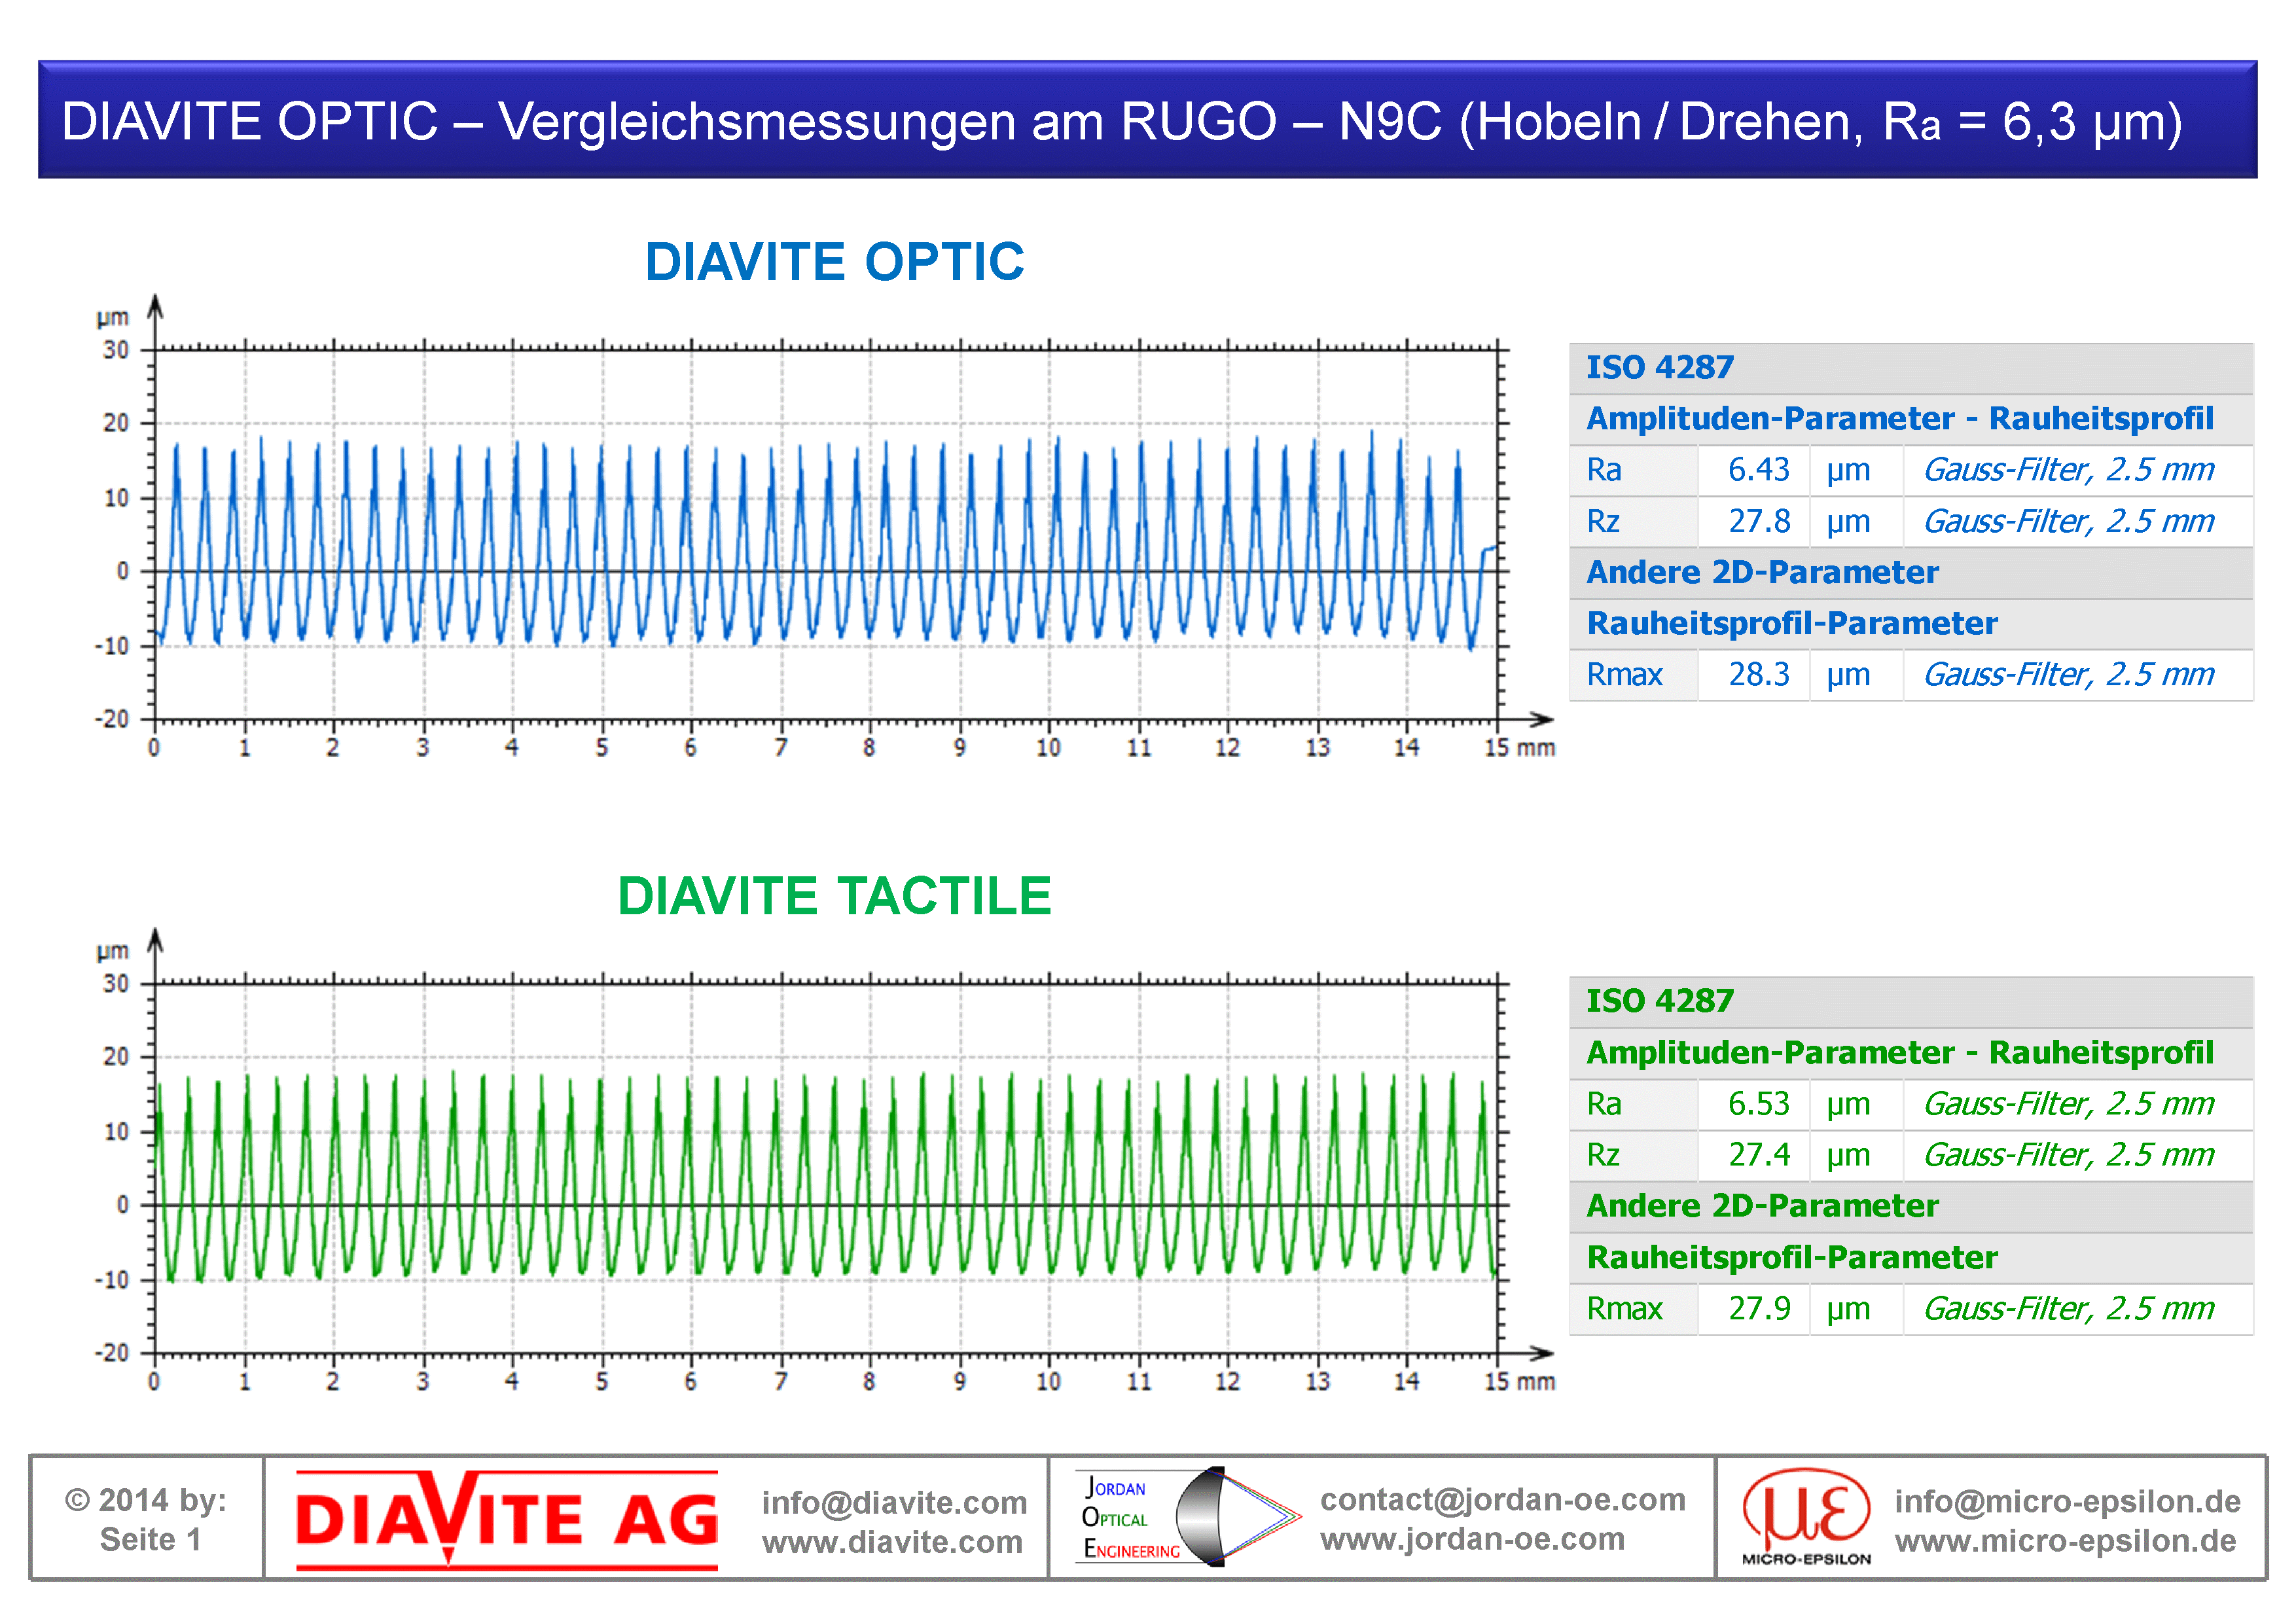
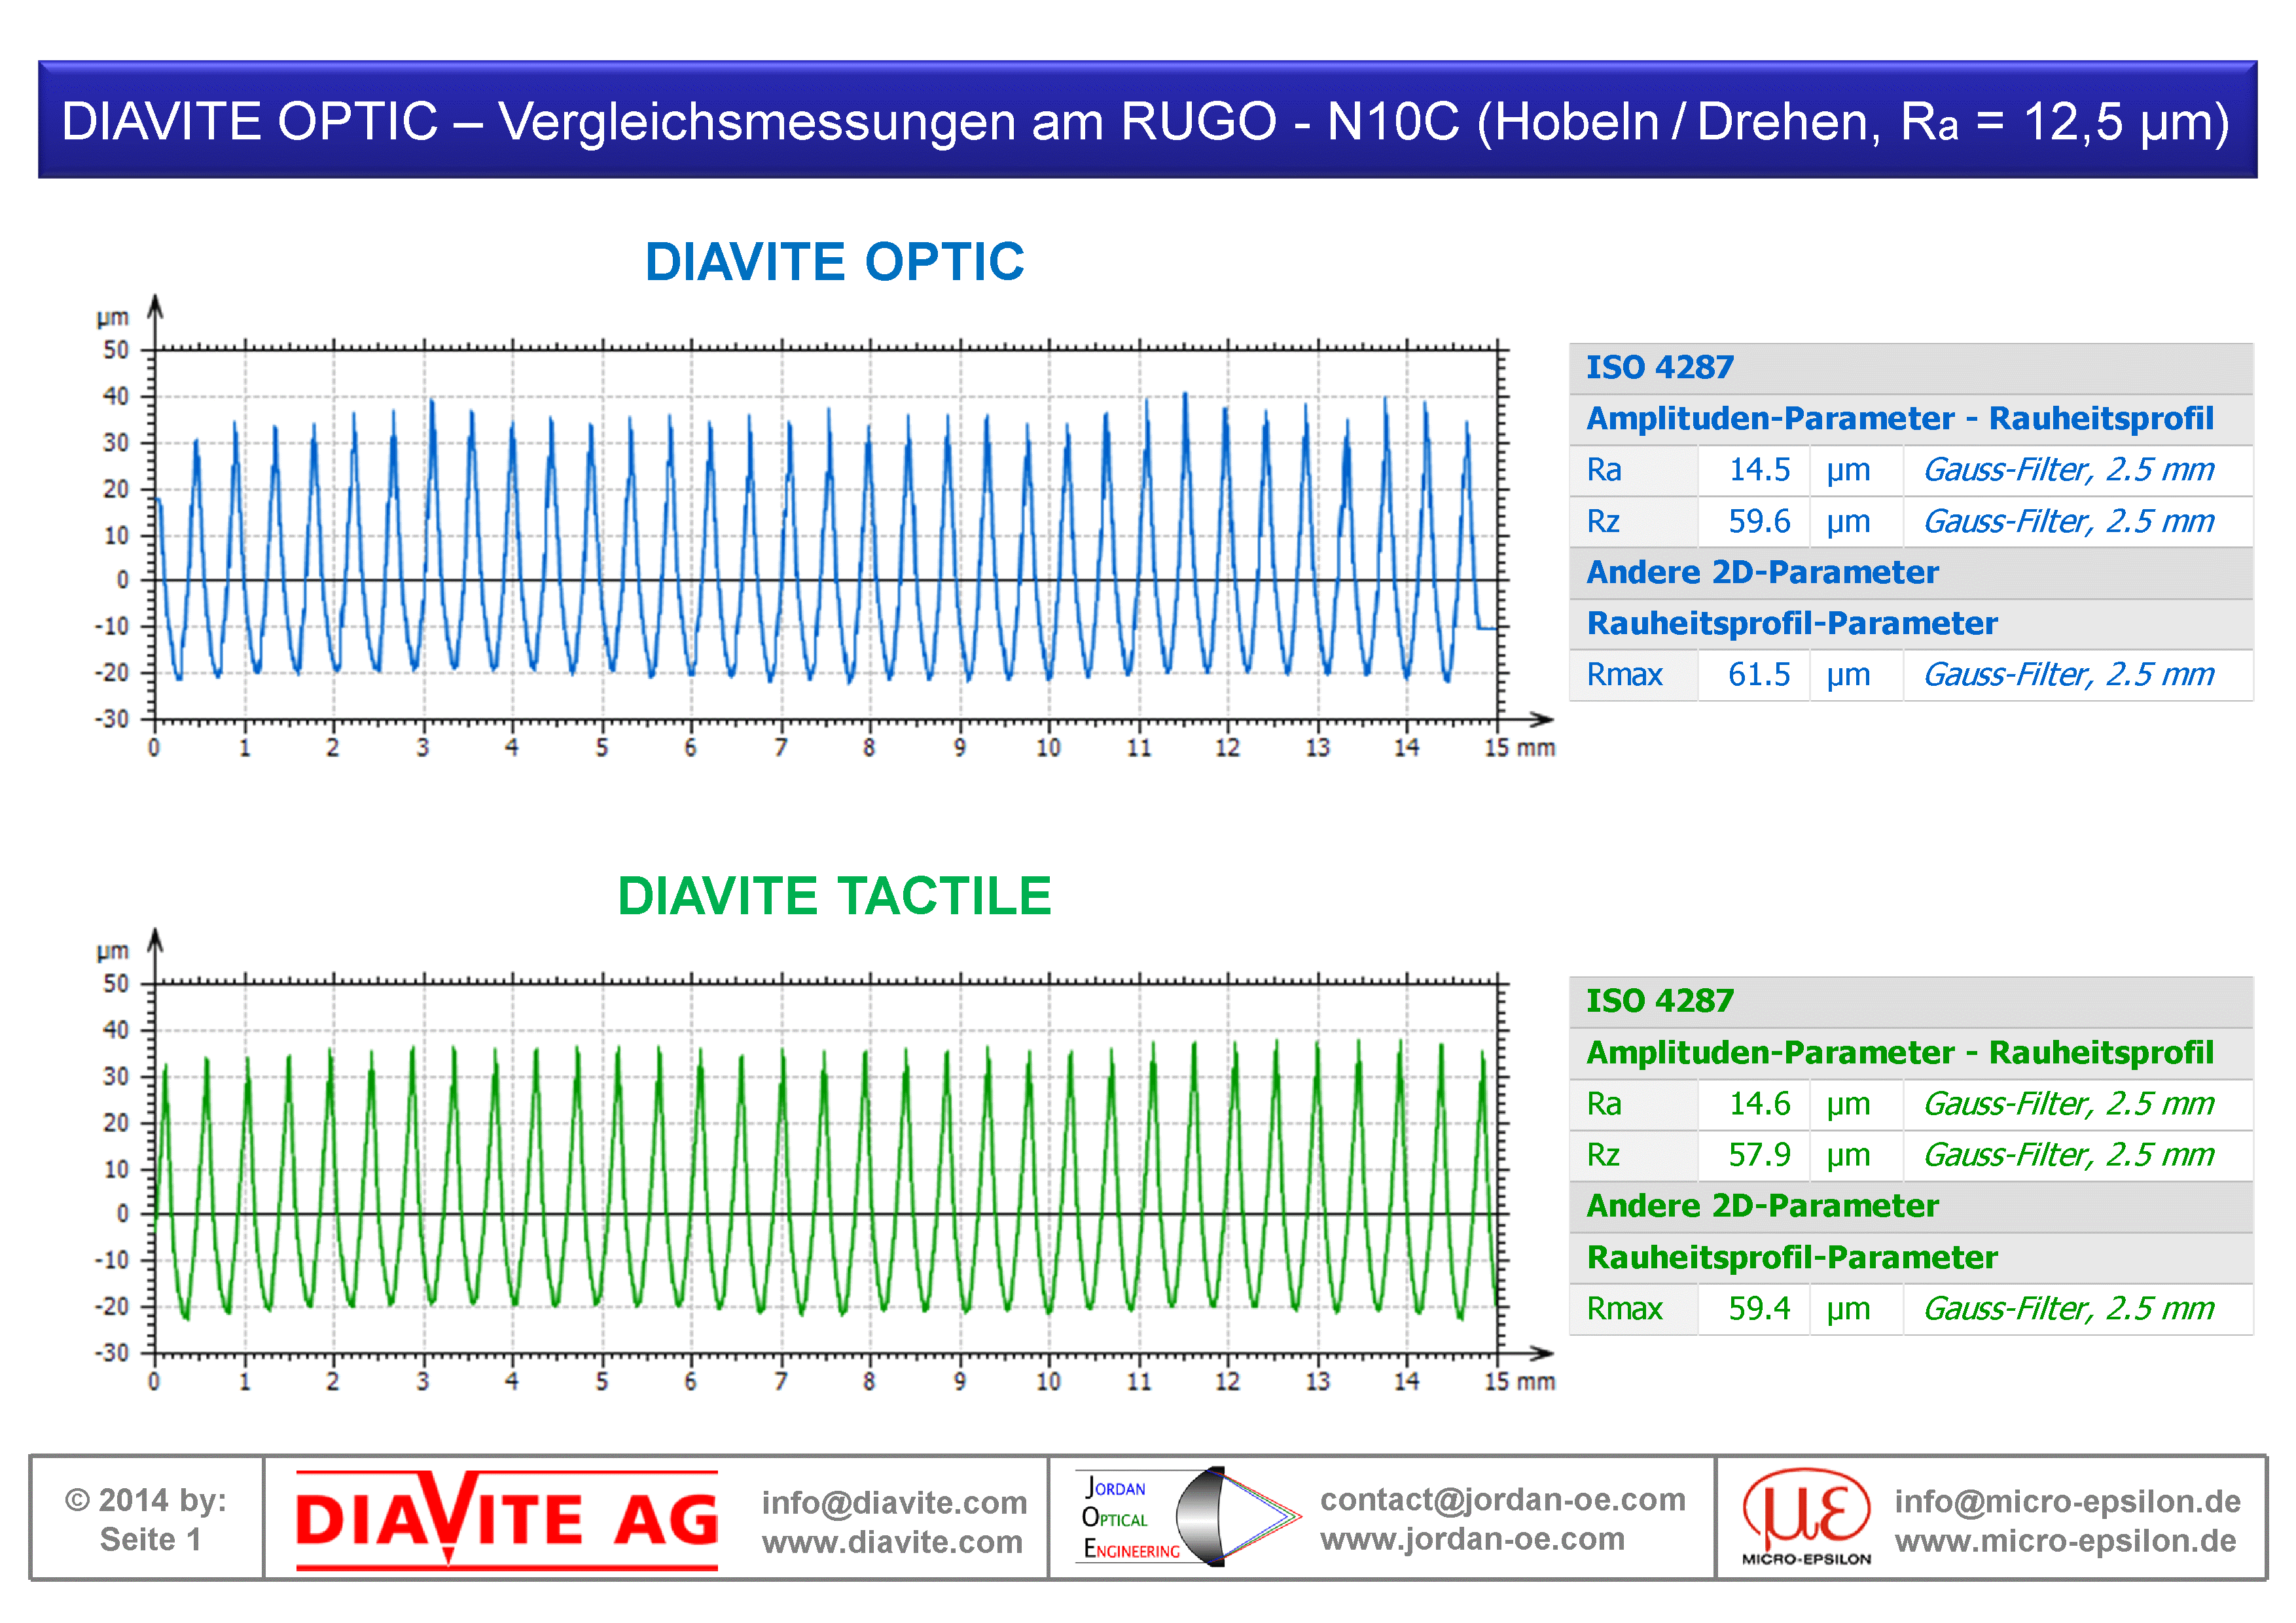
RUGO-N9C (Ra 6,3 µm), RUGO-N10C (Ra 12,5 µm)
Planed / turned surfaces are primarily one-dimensional rough and can therefore be compared well via profile sections.
Comparison of optical measurements (blue profiles) and tactile comparison measurements (green profiles) on two planed / turned surfaces.
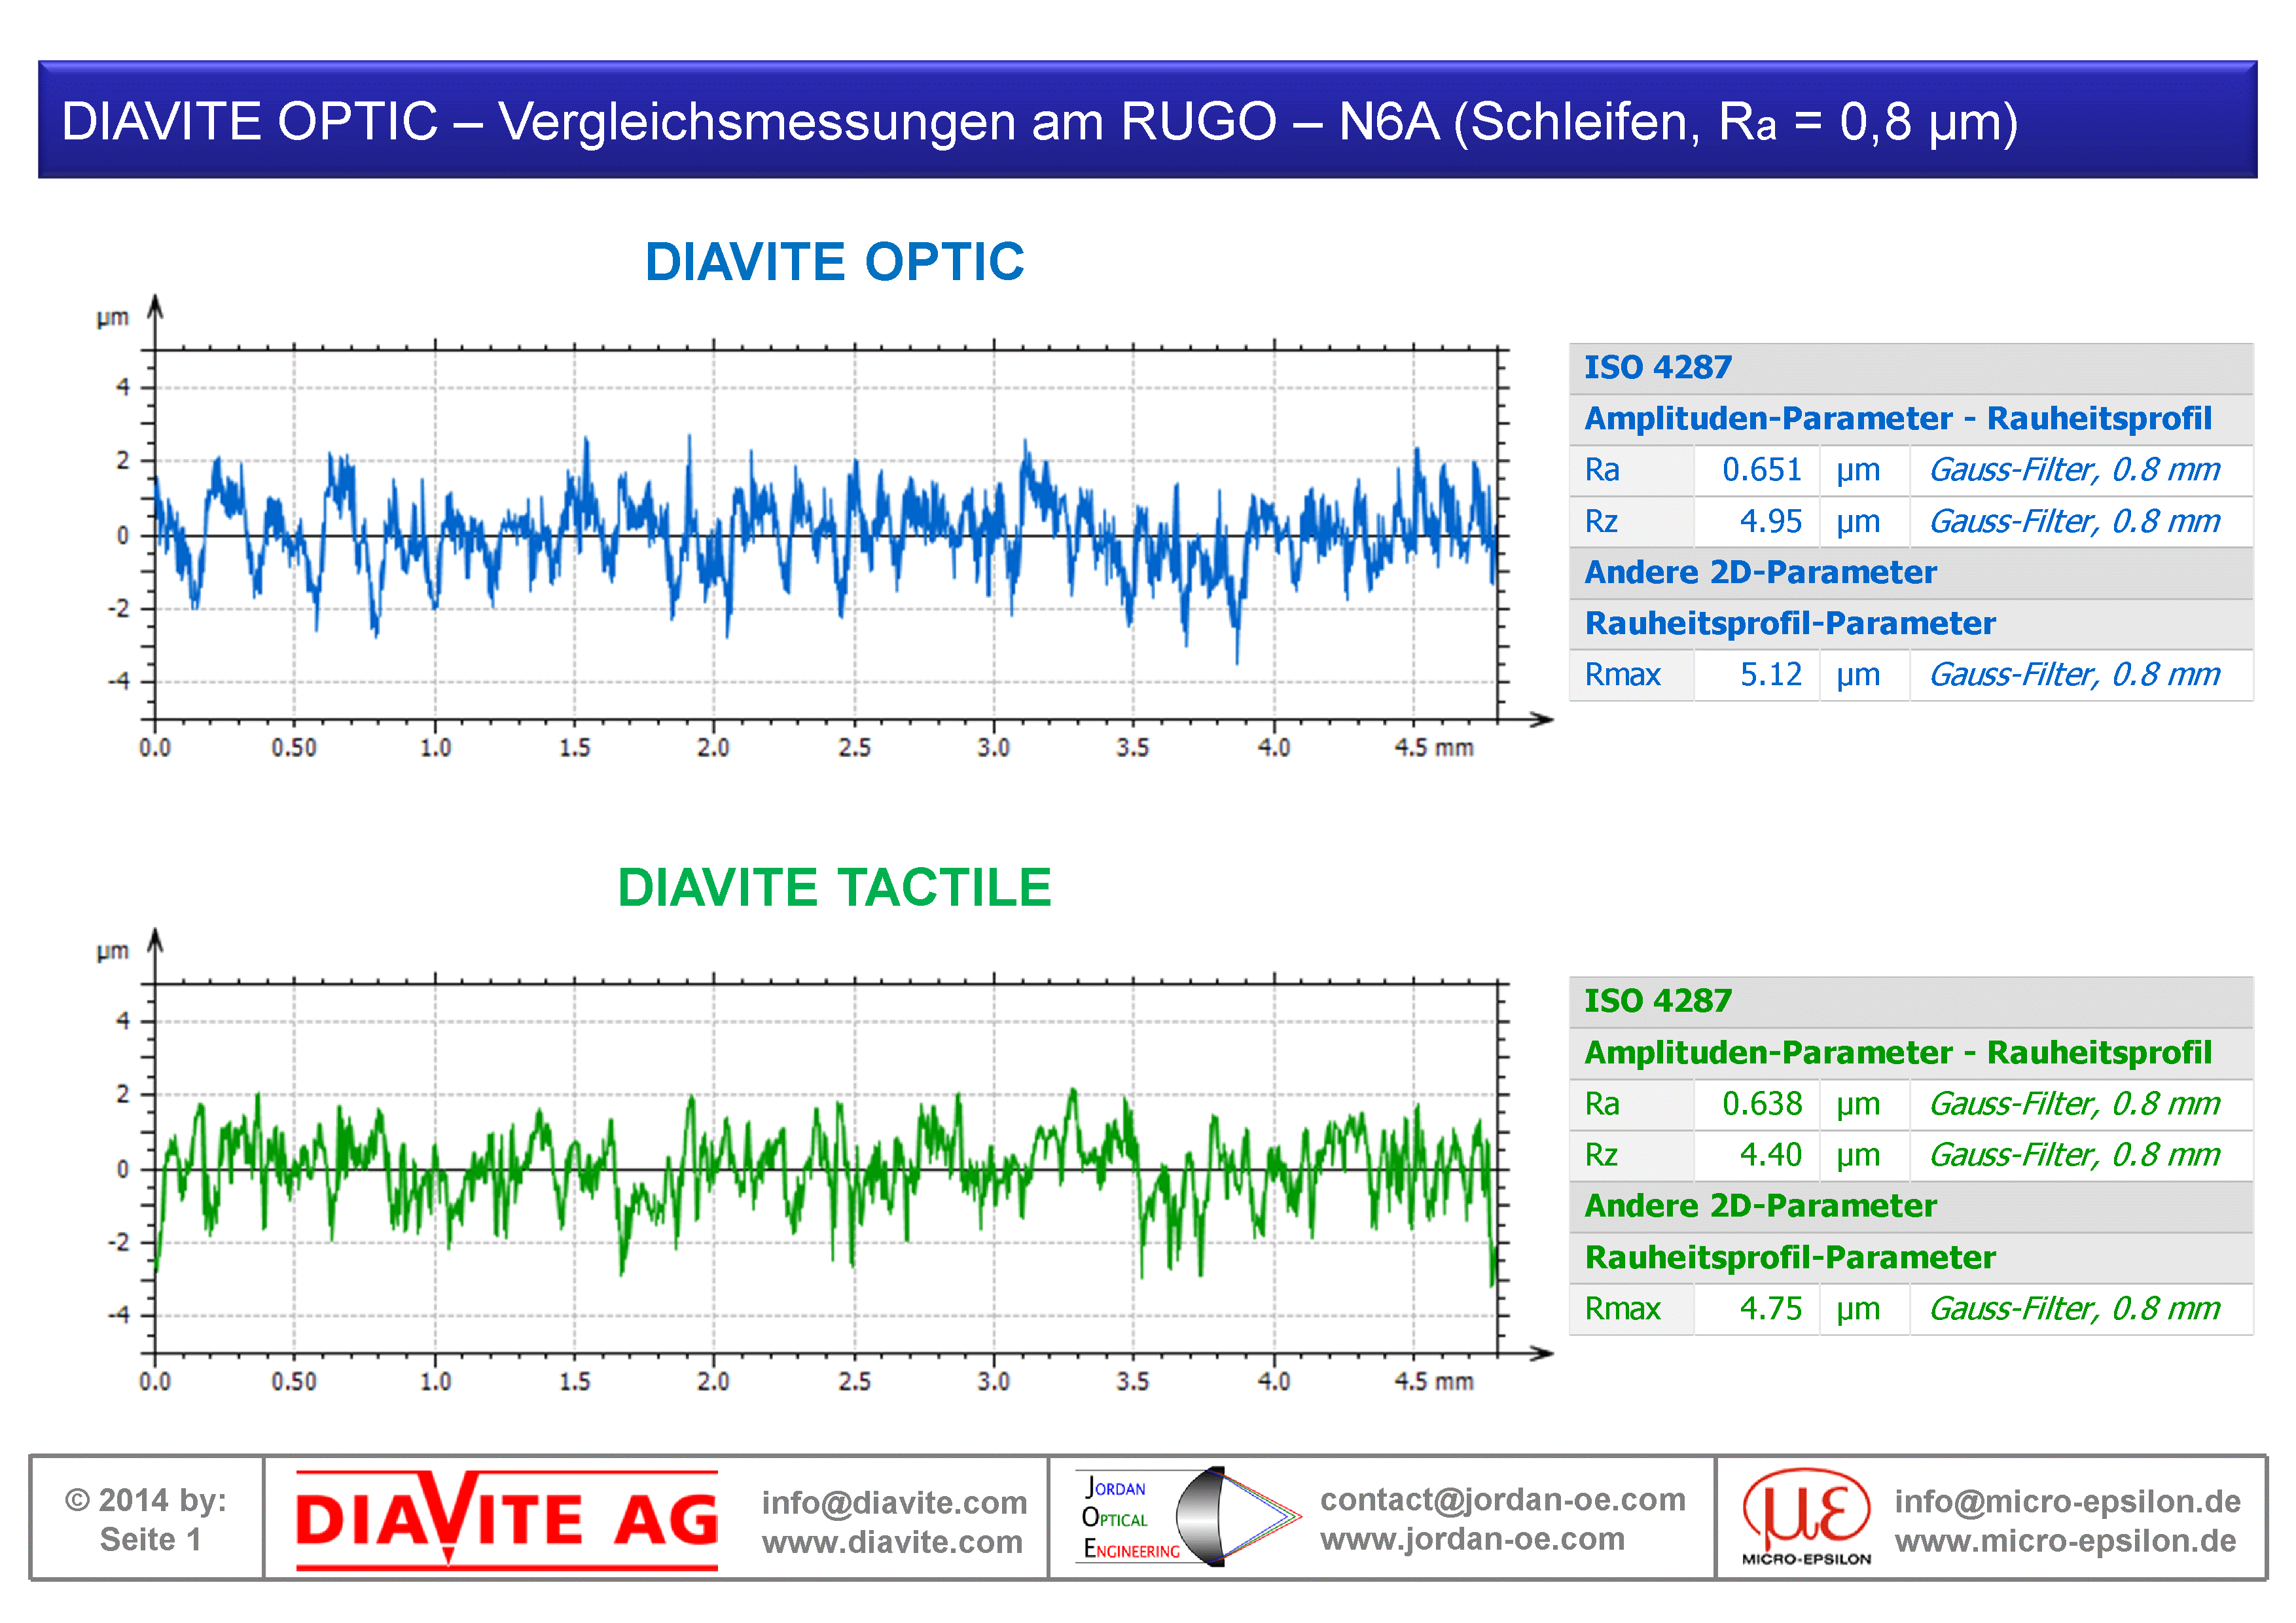
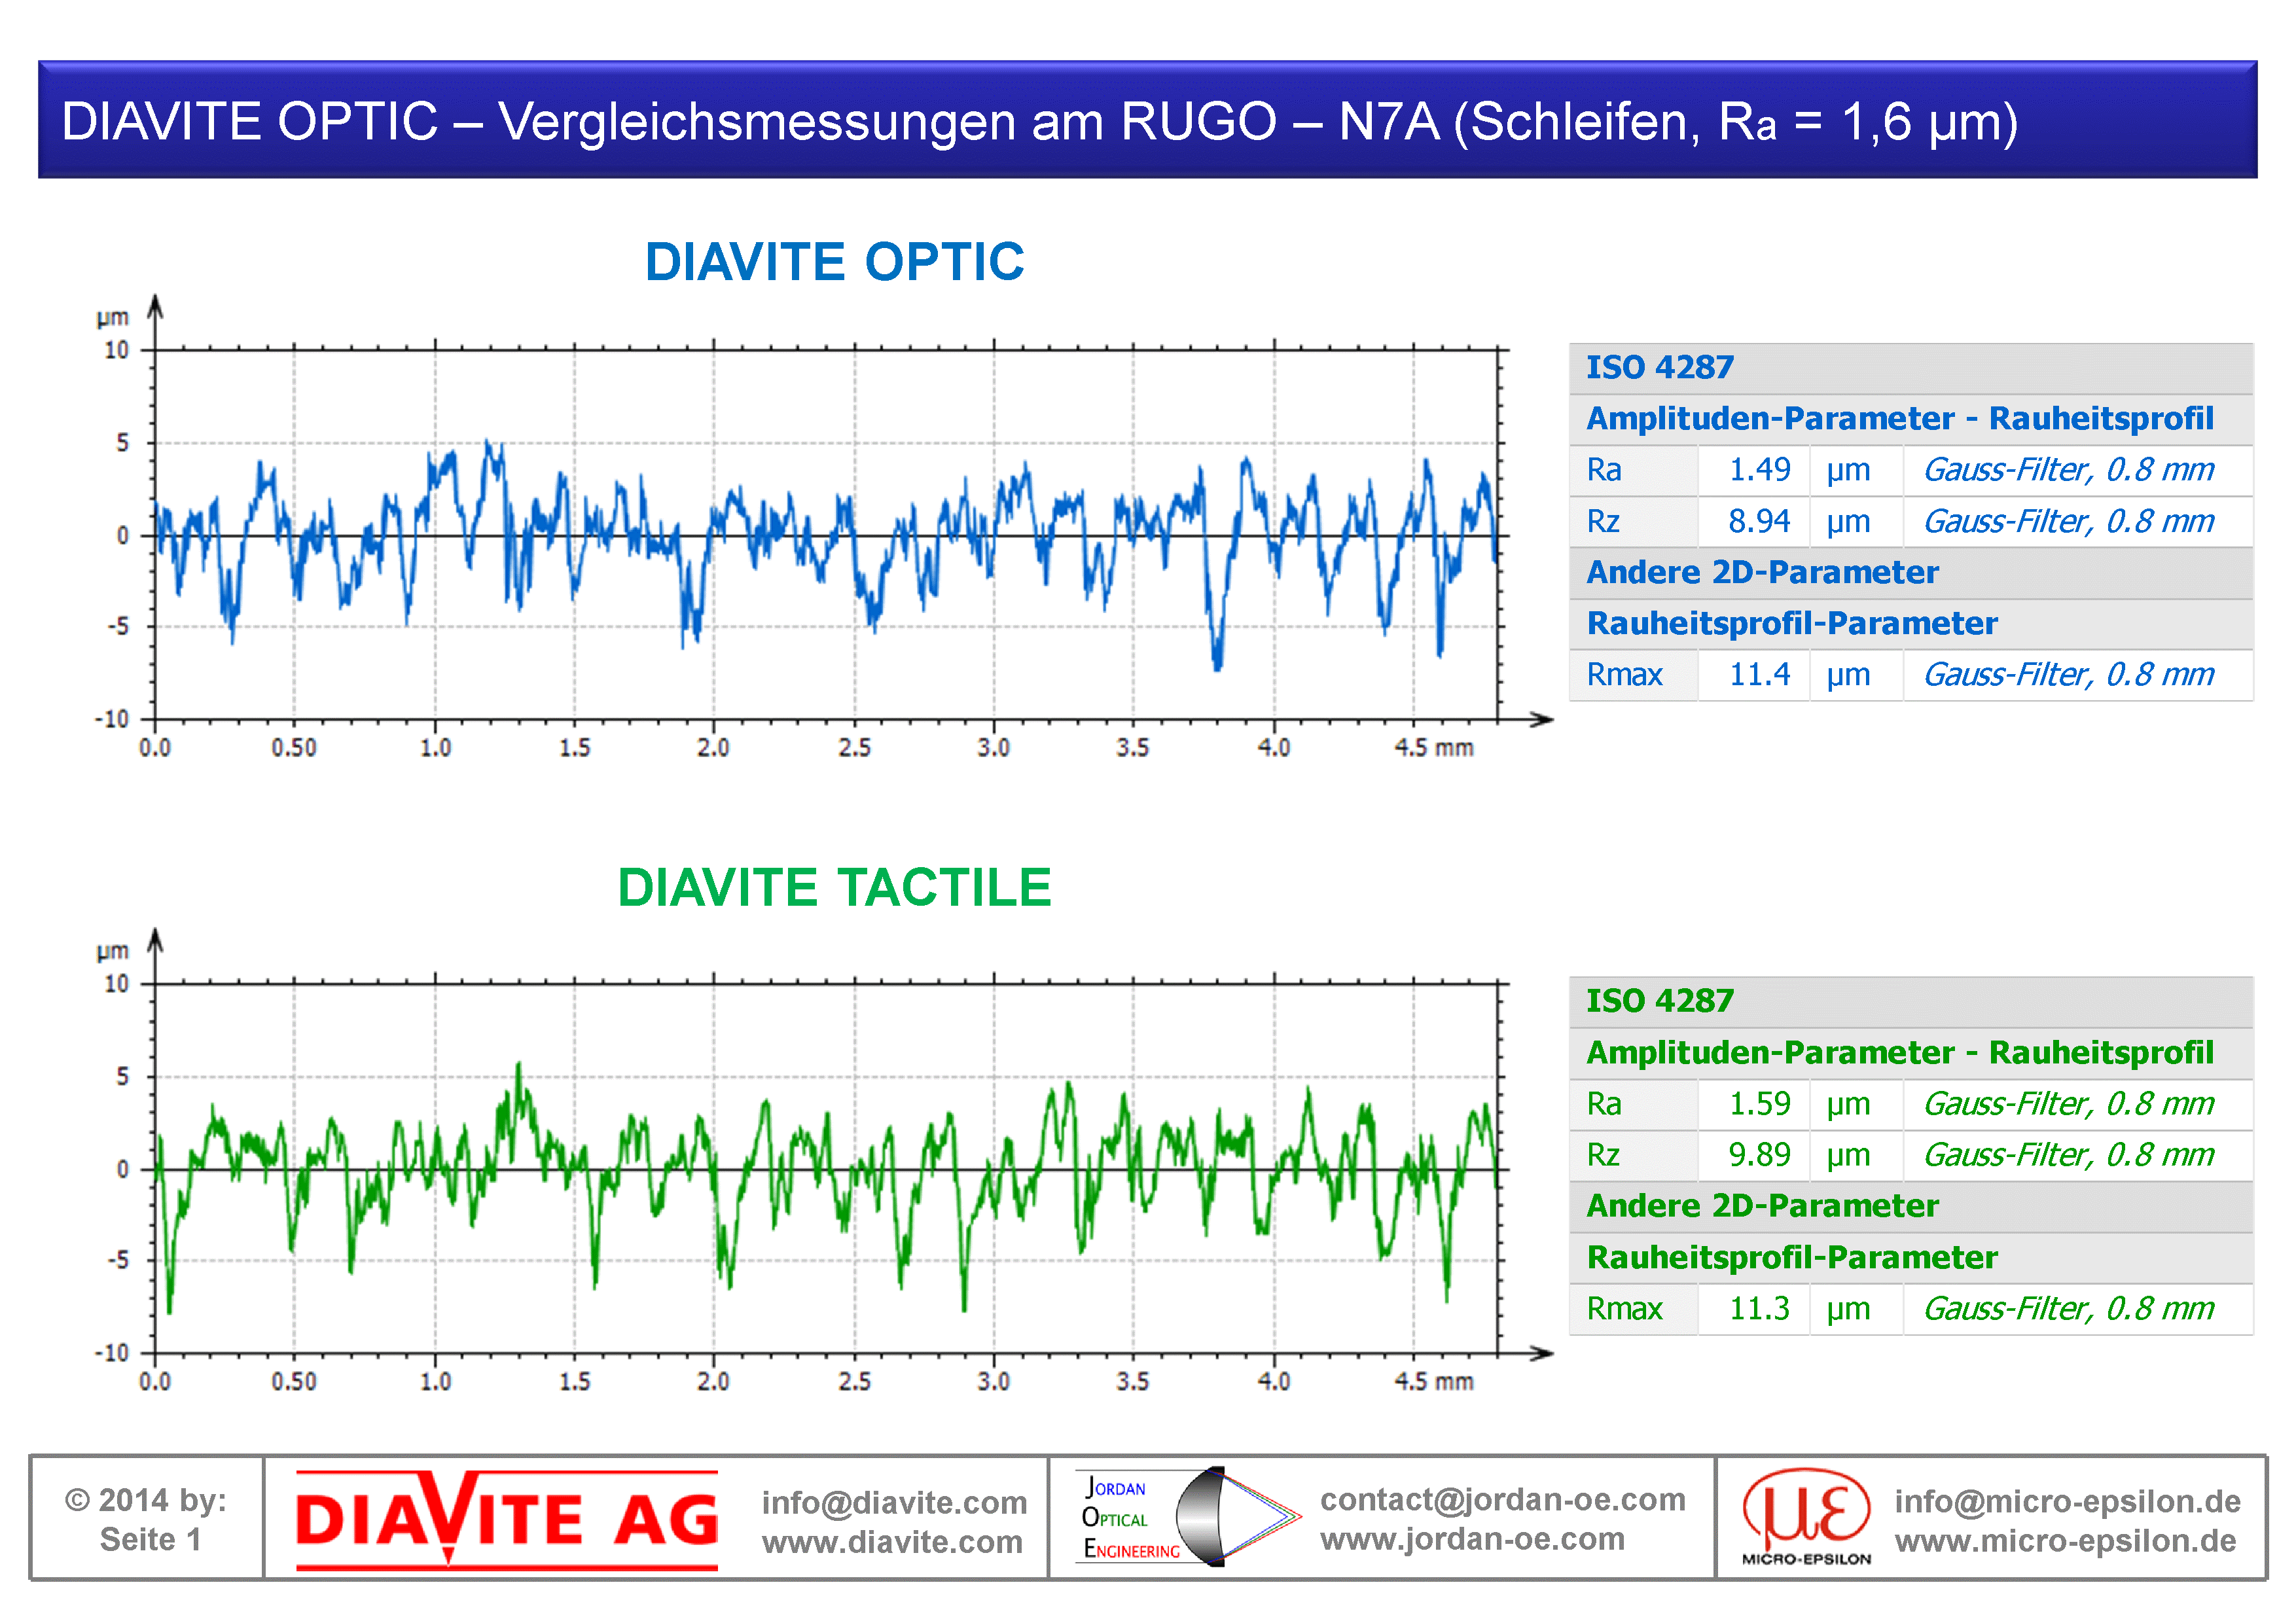
RUGO-N6A (Ra 0,8 µm), RUGO-N7A (Ra 1,6 µm)
Although ground surfaces are rough in two dimensions, they usually do not show any superimposed texture. Therefore, they can be compared well via profile sections.
Comparison of optical measurements (blue profiles) and tactile comparison measurements (green profiles) on two ground surfaces.